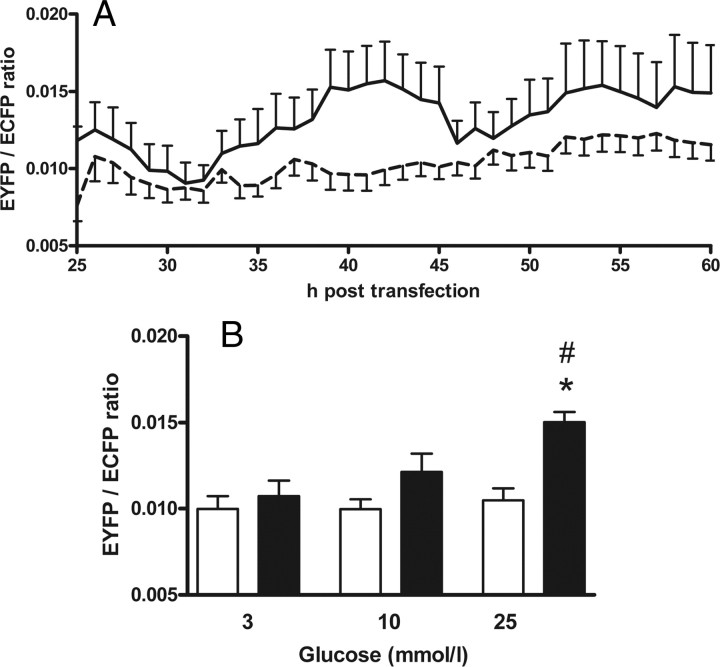
Fig. 3.
The interaction strength between GK and PFK-2/FBPase-2 rises with increasing glucose concentrations. The interaction of the fusion proteins DNA-BD-PFK-2/FBPase-2 and AD-GK was measured in a semiautomated fluorescence-based mammalian two-hybrid assay. DNA-BD-PFK-2/FBPase-2 and AD (dashed line in A and white bars in B) or DNA-BD-PFK-2/FBPase-2 and AD-GK (solid line in A and black bars in B) were coexpressed in insulin-secreting MIN6 cells. In cells cultured at 3, 10, or 25 mmol/liter glucose, respectively, the degree of interaction between DNA-BD and AD proteins was analyzed every hour as the mean value for the nuclear EYFP/ECFP ratio. A, Images were taken hourly over a period of 40 h. The time lapse of the calculated EYFP/ECFP ratio is exemplary, shown for a representative single experiment for the interaction of GK with islet PFK-2/FBPase-2 at 25 mmol/liter glucose (solid line) together with the respective negative control at 25 mmol/liter glucose (dashed line). Data are expressed as means ± sem of 2–120 nuclei analyzed per time point. B, The mean nuclear EYFP/ECFP ratios obtained between 36 and 48 h after transfection were determined together with the respective sem for 341–1369 cells per sample. The means ± sem of the EYFP/ECFP ratio are shown for three to five independent experiments with a total of 1331–5905 nuclei analyzed. *, P < 0.05 compared with negative control, #, P < 0.05 compared with cells incubated with 3 mmol/liter glucose (ANOVA/Bonferroni’s test).

