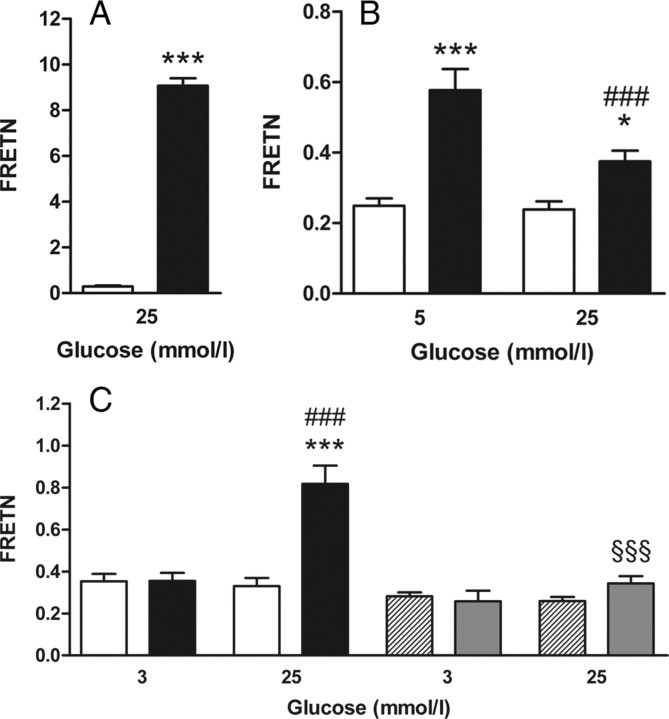
Fig. 5.
Effect of low vs. high glucose on FRET between GK and its binding partners GRP and islet PFK-2/FBPase-2. Fluorescent proteins were coexpressed in COS cells and precultured with the indicated glucose concentrations. Thereafter, fluorescence images were taken in living cells, and the sensitized emission-based FRET efficiency (FRETN) was calculated from the ECFP and EYFP emission intensities. A, FRETN between separately expressed ECFP and EYFP (white bars) or the fluorescent fusion protein ECFP-EYFP (black bars). B, FRETN between EYFP-GRP and ECFP (white bars) or ECFP-GK (black bars). C, FRETN between EYFP-PFK-2/FBPase-2 and ECFP (white bars) or ECFP-GK (black bars), and between EYFP-PFK-2/FBPase-2-Mut and ECFP (dashed bars) or ECFP-GK (gray bars). Data are expressed as means ± sem of three individual experiments with a total of 8–22 cells analyzed. *, P < 0.05; ***, P < 0.001 compared with negative control; ###, P < 0.001 compared with cells incubated with 3 mmol/liter or 5 mmol/liter glucose; §§§, P < 0.001 compared with EYFP-PFK-2/FBPase-2 wild type, respectively (panel A, Student’s t test; panels B and C, ANOVA/Bonferroni’s test).

