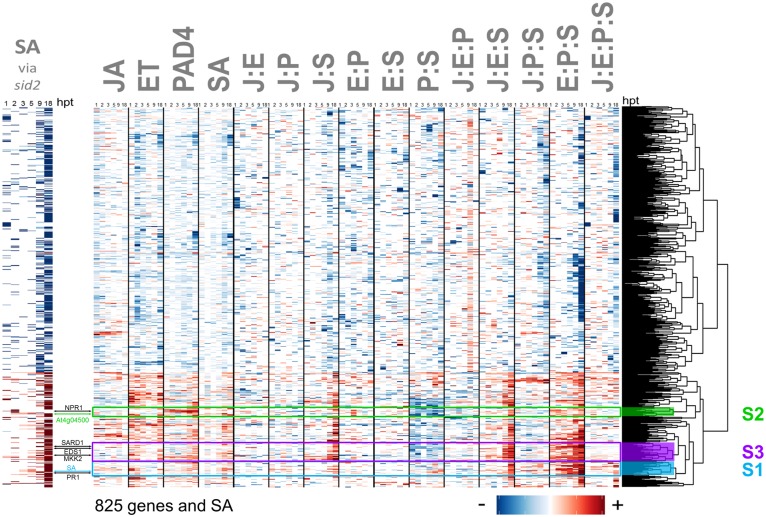
Fig 8. Network reconstitution reveals multiple regulatory mechanisms controlling expression of the traditionally-defined SA-dependent genes.
Signaling allocations are shown for the 825 genes that had a significant transcript level change in sid2 relative to the transcript level in wild type among the 5191 flg22-responsive, network-dependent genes/hormones. The left panel shows the strength of a traditionally-defined SA response: those with decreased and increased transcript levels in the single sector mutant compared to wild type are shown by red and blue bars, respectively. For genes that are positively regulated by SA according to this traditional definition (red rows in the left panel), the network reconstitution revealed multiple regulatory patterns, which include genes whose regulation closely followed that of SA (sky blue arrow), and thus were regulated almost entirely by network interactions (cluster S1, sky blue) and those that share a regulatory pattern with the PAD4 sector activity marker AT4G04500 (green arrow; cluster S2, green). Some of the genes whose expression is well known to be affected by SA, NPR1, SARD1, EDS1, MKK2, and PR1, are also indicated by black arrows. The cluster including SARD1, EDS1, and MKK2 (cluster S3, purple) appears to be a mixture of characteristics of clusters S1 and S2. Cluster S3 genes may be mainly regulated by additive effects of the SA and PAD4 sectors. Although the SID2 gene itself is very close to the bottom of the heatmap, below cluster S1, and the PAD4 gene is slightly above cluster S2 in the heatmap, the data for the transcript levels of these genes cannot be properly interpreted in this dataset since each of these genes is mutated by design in half of the combinatorial genotypes.

