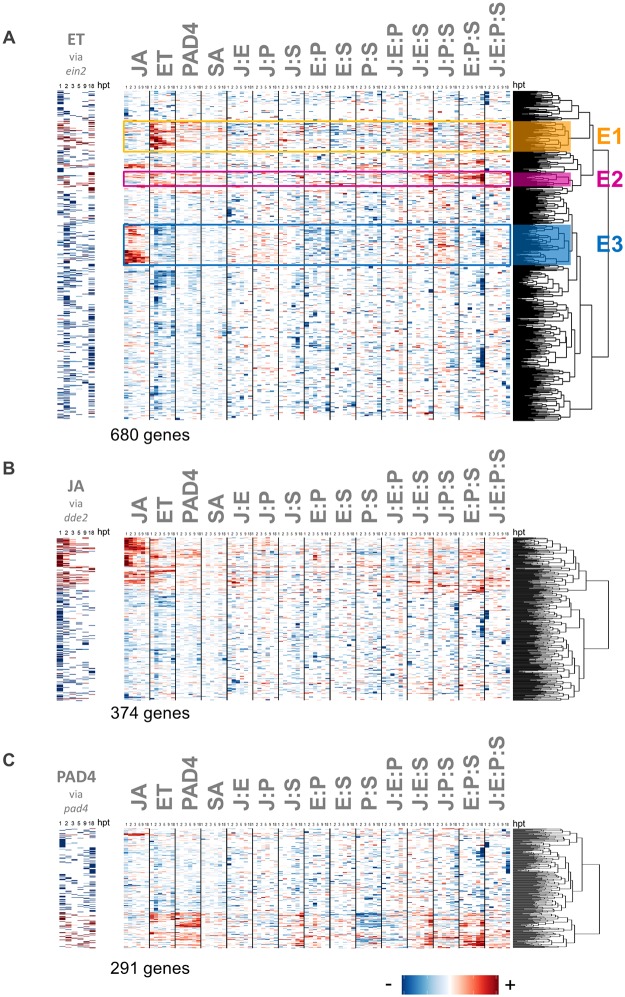
Fig 9. Regulation of genes strongly impacted by the ET, JA, and PAD4 single sector perturbations.
Network reconstitution uncovers the regulation of genes whose flg22 transcript response changes are strongly impacted by the ET (A), JA (B), and PAD4 (C) single sector perturbations dde2, ein2, and pad4, respectively. Signaling allocations are shown for the 680 genes (A), 374 genes (B), and 291 genes (C) that had a significant transcript level response in ein2 (A), dde2 (B), and pad4 (C) relative to the transcript response in wild type. The left panels show the strength of a traditionally-defined sector response: those with decreased and increased transcript levels in the single sector mutant compared to wild type are shown by red and blue bars, respectively. Three clusters (E1, E2 and E3) are indicated by orange, purple, and blue colors, respectively. Signaling allocation rows were scaled for better visualization using the most extreme value of each row.

