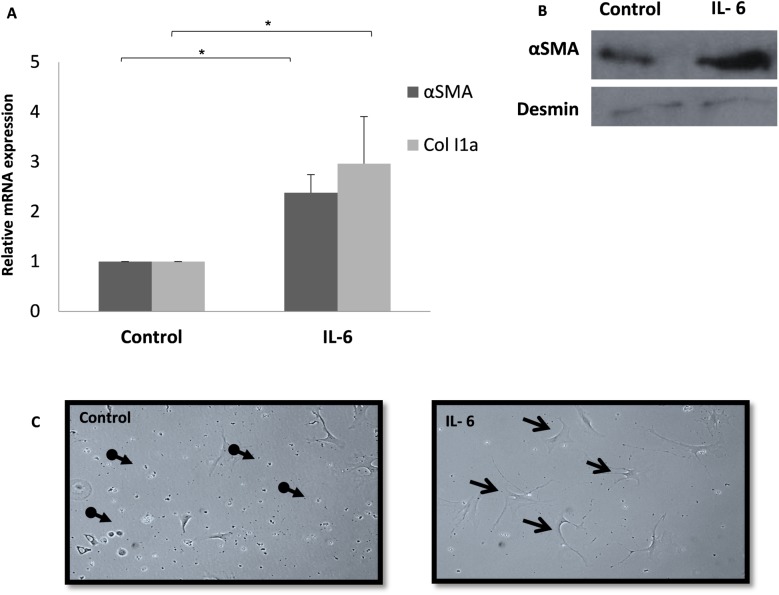
Fig 2. Alterations in HSCs characteristics following treatment with IL6.
Freshly isolated primary HSCs were treated with 100 ng/ml IL-6 in 2% FBS DMEM. HSCs were harvested 24 h later and the levels of αSMA and Col1a were evaluated using qRT-PCR. qPCR relative mRNA expression levels are shown. Error bars indicate standard deviation, * p < 0.05. (A). Protein lysates prepared after 96 h exposure to 100 ng/ml IL-6, were subjected to Western blotting using antibodies for αSMA, and desmin as a reference gene (B). Representative light microscopy images of HSCs treated with 100 ng/ml IL-6 for 96 h (C) Non-activated HSC cells are marked with the broken line arrow and activated cells are marked with the full line arrow.

