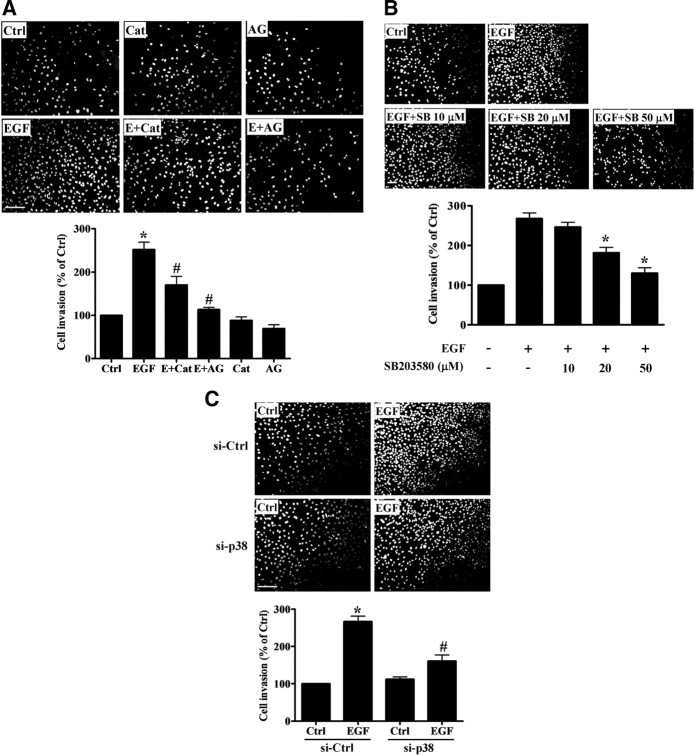
Fig. 8.
EGF-induced cell invasion involves H2O2 production and p38α MAPK expression. A, SKOV3 cells were treated for 1 h with AG1478 (AG) (10 μm) or PEG-catalase (Cat) (1000 U/ml) in the presence or absence of 100 ng/mL EGF. B, Cells were treated with 100 ng/ml EGF in combination with different doses of SB203580 (SB). C, Cells were transfected with p38α MAPK siRNA for 48 h and then treated with 100 ng/ml EGF. After treatment, cells were seeded into Matrigel-coated transwell inserts and cultured for 24 h. Noninvading cells were wiped from the upper side of the filter, and the nuclei of invading cells were stained with Hoechst 33258. Top panels show representative photos of the invasion assay. Scale bar, 200 μm. Bottom panels show summarized quantitative results, which are expressed as mean ± sem of at least three independent experiments. *, P < 0.05 compared with control (Ctrl); #, P < 0.05 compared with EGF.

