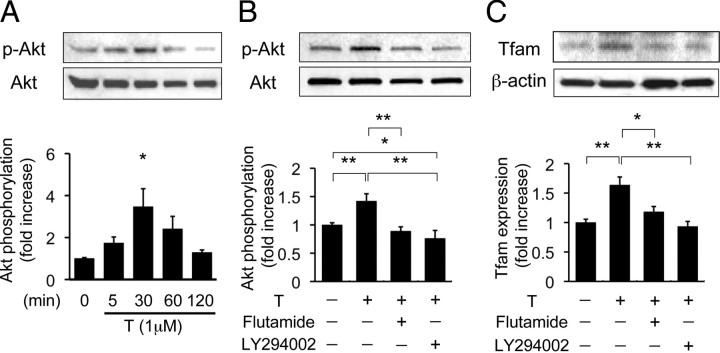
Fig. 4.
Acute effect of androgen action on Akt phosphorylation (p-Akt) and Tfam expression in H9c2 cells. A, upper panel, Representative blots of phosphorylated Akt and total Akt. Lower panel, Results of densitometric analysis of phosphorylated Akt. Values are expressed as means ± sem. *, P < 0.05 vs. with control, n = 4 in each group. B, Akt phosphorylation in H9c2 cells with or without flutamide or LY294002. Upper panels, Representative blots of phosphorylated forms of Akt and total Akt. Lower panels, Results of densitometric analysis of phosphorylation of Akt pretreated with or without flutamide or LY294002 for 1 h before testosterone administration in H9c2 cells. Values are expressed as means ± sem. *, P < 0.05; **, P < 0.01 n = 6 in each group. C, Tfam expression in H9c2 cells with or without flutamide or LY294002. Upper panels, Representative blots of Tfam expression and β-actin. Lower panels, Results of densitometric analysis of phosphorylation of Akt pretreated with or without flutamide or LY294002 for 1 h before testosterone (T) administration for 24 h in H9c2 cells. Values are expressed as means ± sem. *, P < 0.05; **, P < 0.01, n = 4 in each group.

