Fig. 1.
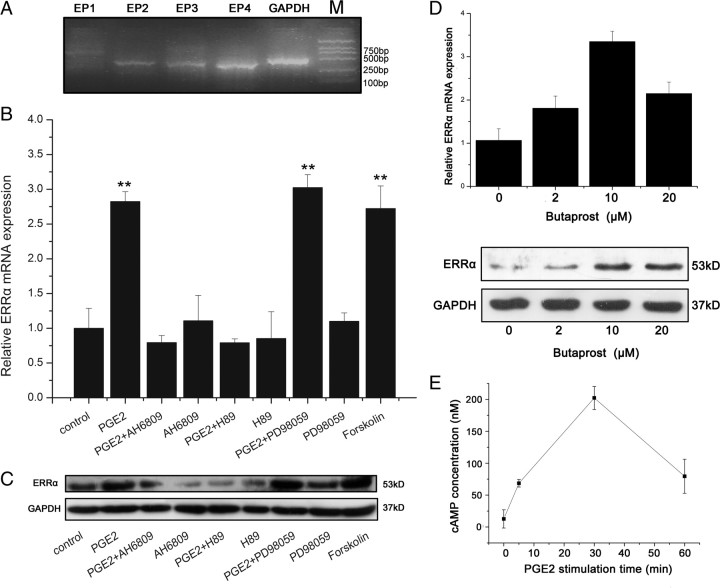
PGE2 induces the expression of ERRα through the PGE2 receptor EP2 and the PKA signaling pathway in WPMY-1 cells. A, RT-PCR analysis of mRNA expression of PGE2 receptor subtypes (EP1–EP4) in WPMY-1 cells. B, Real-time RT-PCR analysis of the effects of PGE2 and/or the EP2 antagonist, the inhibitor of PKA, the inhibitor of MAPK pathway or forskolin on mRNA expression of ERRα in WPMY-1 cells. Cells were pretreated with or without AH6809 (10 μm) or H89 (0.5 μg/ml) or PD98059 (25 nm) for 30 min, and then treated with PGE2 (1 μm), or Forskolin (1 μm) for 12 h. Total RNA was extracted and real-time RT-PCR was performed using ERRα and housekeeping gene primers. Values represent mean ± sd of three independent experiments. **, P < 0.01 compared with untreated controls. C, Western blot analysis of the effects of PGE2 and/or the EP2 antagonist, the inhibitor of the PKA, the inhibitor of MAPK pathway or forskolin on protein expression of ERRα in WPMY-1 cells. Cells were preincubated for 30 min in the absence or presence of DMSO (vehicle), AH6809 (10 μm), H89 (0.5 μg/ml), or PD98059 (25 nm) followed by addition of PGE2 (1 μm), or forskolin (1 μm) for 24 h. Whole cell lysates were subjected to Western blot analysis using antibodies against ERRα and GAPDH. The experiments were performed in duplicate. Similar results were obtained from separate experiments. D, Effect of butaprost on ERRα expression. WPMY-1 cells were treated with 2, 10 or 20 μm butaprost. After 12 h or 24 h, total RNA or protein was extracted and analyzed by real-time RT-PCR or Western blot, respectively. D, Upper panel, Real-time PCR data. Values represent means ± sd (n = 4) of three independent experiments. *, P < 0.05 compared with untreated controls. D, Lower panel, Western blot analysis was performed using antibodies to ERRα or GAPDH. The experiments were performed in duplicate. Similar results were obtained from separate experiments. E, Effect of PGE2 on cAMP production. WPMY-1 cells were treated with 1 μm PGE2 in DMEM supplemented with 1% FBS and cell lysates were collected at the indicated time points. Concentrations of cAMP were quantified by using a kit (cAMP-Glo Assay, V1501; Promega). Values represent mean ± sd (n = 4).

