Fig. 6.
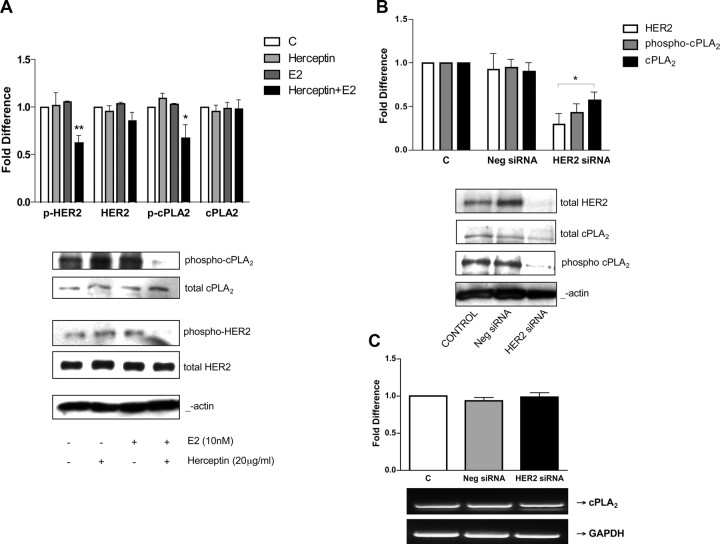
Inhibition of HER2 in SKBR3 cells decreases cPLA2 activation and expression. Panel A, SKBR3 cells were treated with 20 μg/ml herceptin for 48 h with or without 10 nm E2 as indicated. Western blot analysis of phospho-cPLA2α, total cPLA2α, phospho-HER2, and total HER2 was performed. β-Actin was used for protein level normalization, and densitometric values are expressed as fold difference vs. vehicle-treated controls. Data are mean values ± se. *, P < 0.01 compared with control values. Panels B and C, SKBR3 cells were transfected with 100 nm of a pool of four different siRNA targeting HER2. Negative control cells were transfected with 100 nm nontargeting siRNA. At 72 h after transfection, total proteins and mRNA were extracted and subjected to either Western blot analysis for total HER2, phospho-cPLA2 (Ser505) and total cPLA2α, (total cPLA2α was used for protein level normalization (panel B) (data are mean values ± se; *, P < 0.001 compared with vehicle-treated control) or semiquantitative RT-PCR using specific primers for cPLA2 (panel C) (expression levels were normalized for GAPDH, and a representative agarose gel is shown along with densitometric analysis of two experiments). C, Control.

