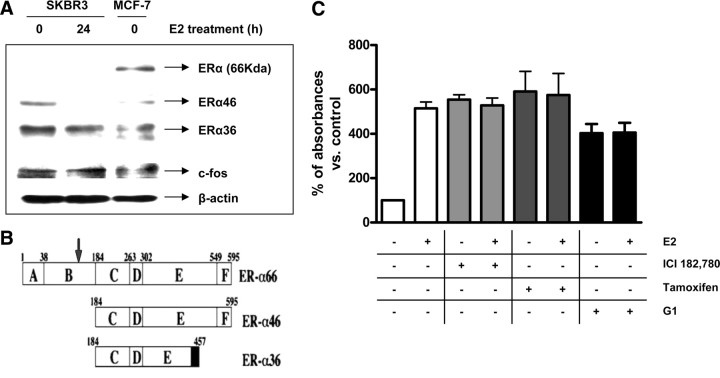
Fig. 8.
Involvement of ER isoforms and GPR30 in mediating the effects of E2 in SKBR3 cells. Panel A, Western blot analysis of total ERα was performed on SKBR3 cells treated with either vehicle (0) or E2 (10 nm) for 24 h and on untreated MCF-7 cells. The different isoforms are indicated at their respective molecular weight. Samples were also probed for c-Fos as a positive control for E2 treatment because E2 was reported to up-regulate c-Fos in the SKBR3 cell line (71 ). β-Actin was used for protein level normalization. Panel B, Structure of the 66-kDa wild-type ERα and the two splice variants ERα36 and ERα46 lacking the N-terminal A/B domain. The different domains (A–F) and amino acid sequence numbers are indicated. An arrow indicates the epitope recognized by the ERα antibody used in this study (adapted from Ref. 51 ). Panel C, MTT cell growth assay was performed on SKBR3 cells treated with either vehicle or E2 (10 nm) with or without ICI (10 μm), tamoxifen (10 μm), or G1 (100 nm) for 48 h. Data are mean values ± se of three independent experiments.

