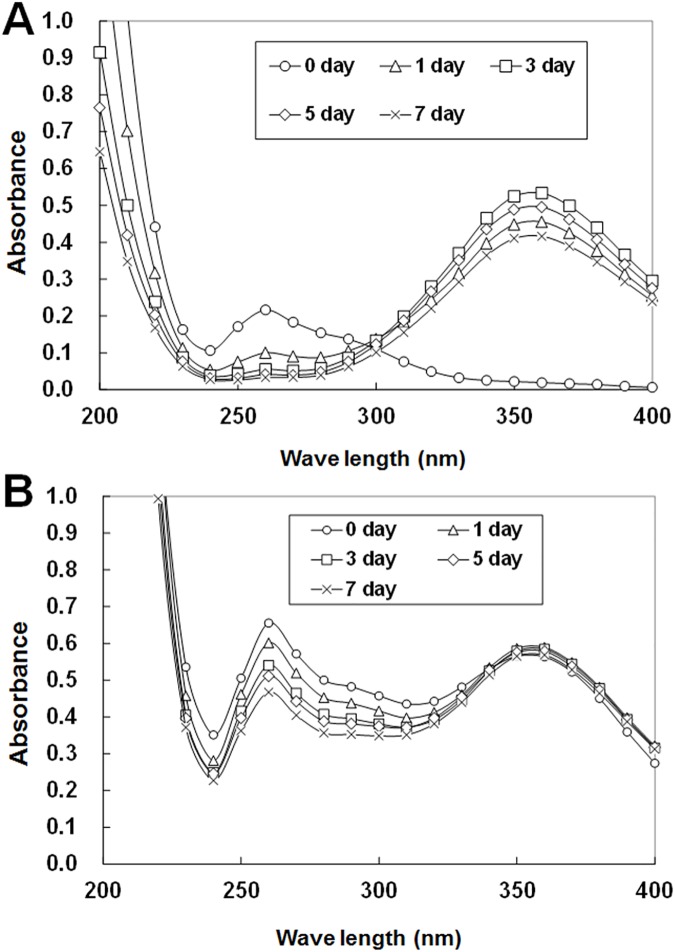
Fig 1.
Spectrophotometric characterizations of ASC (A) and WACAW (B). Spectra were measured at the indicated day after preparation. The peaks around 260 nm and 360 nm indicate ClO2- and ClO2, respectively. ASC and WACAW were diluted with distilled water at 10- and 100-fold for the absorbance to be within the measurable range.

