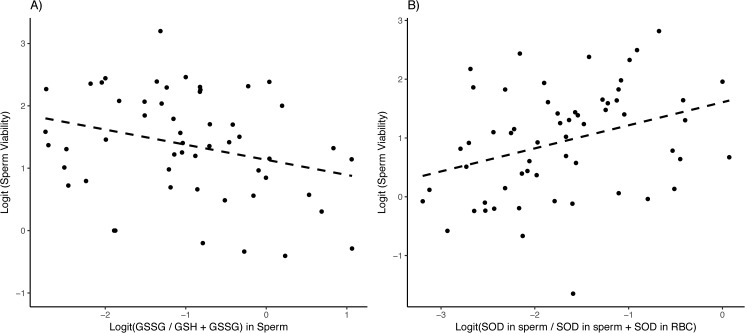
Fig 4.
Relationship between the proportion of motile sperm with (A) the proportion of oxidized over total glutathione (GSSG/GSH+GSSG) (F1,50.8 = 4.67, p = 0.036, slope = -0.25 ± 0.11) before manipulating the social status, and (B) the proportion of SOD in sperm relative to total SOD activity (SODsperm/SODsperm + RBCs) (F1,56.9 = 7.78, p = 0.007; slope = 0.43 ± 0.15) after manipulating the social status. The dotted lines represent linear regressions.

