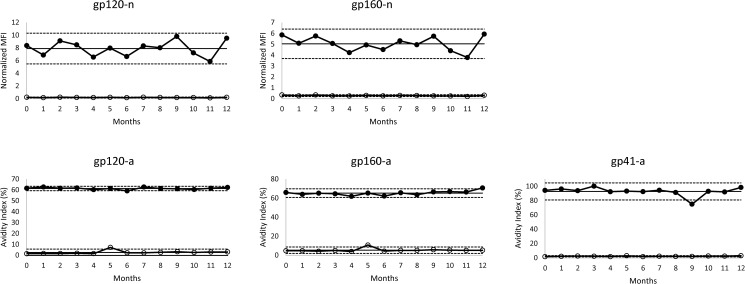
Fig 1. HIV-1 Multiplex assay kit stability.
Levey-Jennings plots of high (closed circles) and low (open circles) positive controls over a 12 month period. The straight solid line represents the mean assay value of the high positive control, while the dashed lines represent 2 standard deviations above and below the mean.

