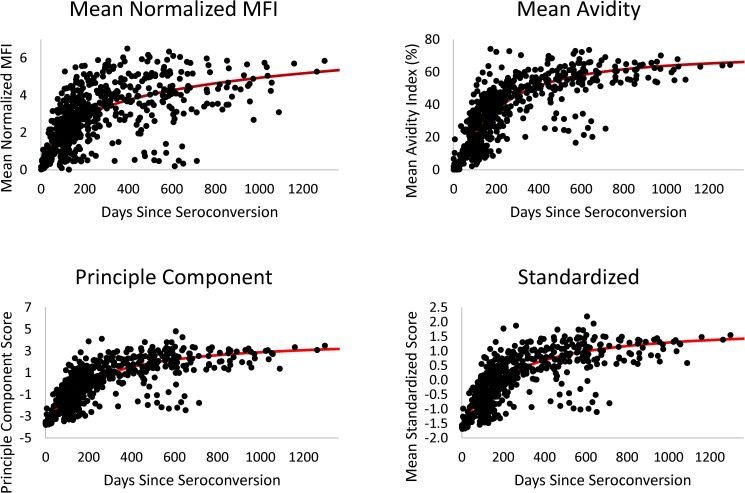
Fig 3. Intra-assay algorithms.
The combined algorithm value for the mean normalized MFI, mean avidity index, principle component, and standardized score methods were plotted over days since estimated seroconversion. The solid red lines represent prediction curves from fitting random intercept models implementing a four-parameter function, score = . Note, the multi-analyte algorithm is not included in the figure since the algorithm takes into account each individual analyte cutoff and does not generate a combined value or score.

