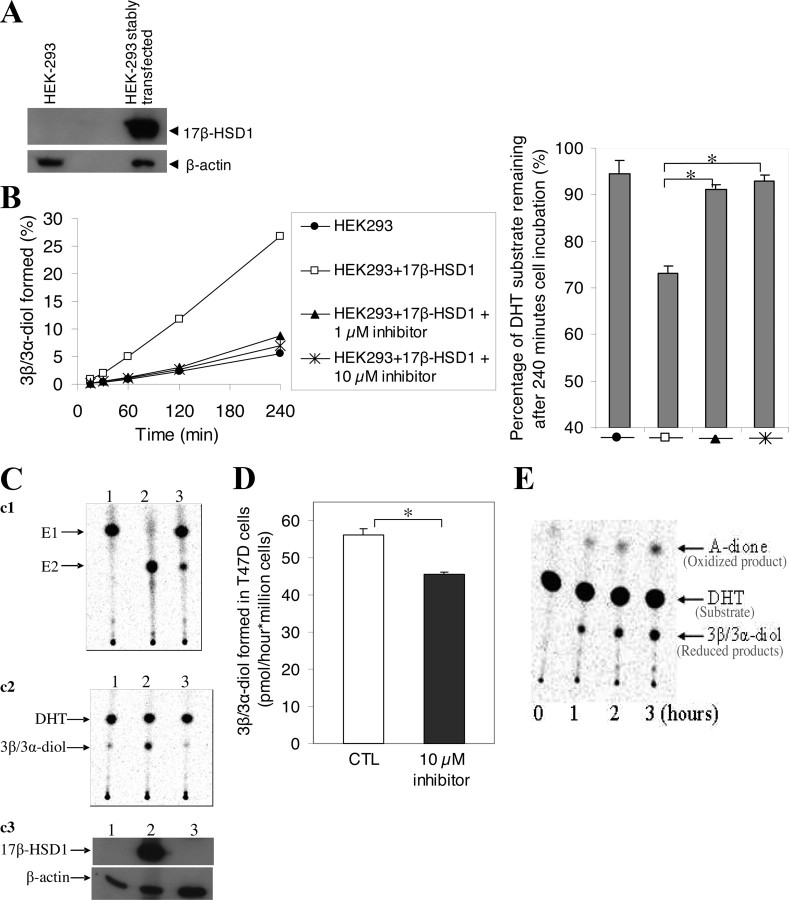
Fig. 2.
DHT inactivation by 17β-HSD1. A, Western blot was carried out using a 17β-HSD1 antibody and total protein extracted from wt HEK-293 and HEK-293 cells stably transfected with 17β-HSD1. B, Activity assays were carried out in wt and stably transfected HEK-293 cells using [14C]DHT as substrate. The 17β-HSD1 inhibitor was used to inhibit its activity in the stably transfected cells. The assay was carried out for four incubation times. The percentage of [14C]DHT substrate remaining in the cell supernatant after 240 min incubation is shown on the left. C, Total protein extracts from MCF7 cells were used in activity assays (c1 and c2) and Western blot (c3) to evaluate the correlation between 17β-HSD1 expression, DHT reduction, and E1 conversion to E2: c1, conversion of [14C]E1 into [14C]E2 after 30 min incubation; c2, reduction of [14C]DHT after 60 min incubation. Numbers (1–3), represent, respectively, protein from untransfected MCF7 cells, protein from MCF7 cells cotransfected with both 17β-HSD1 plasmid and control siRNA (SNC1 siRNA), and protein from MCF7 cells cotransfected with both 17β-HSD1 plasmid and specific siRNA (siRNA2). D, Activity assay carried out in wt T47D cells using [14C]DHT as substrate. CTL represents the control cells incubated without inhibitor. The spots representing the oxidized and reduced products on TLC plate after activity assay in the control cells were shown in E. Numbers (0–3), Periods (in hours) of cell incubation. Error bars, sd. *, P < 0.05 by Student’s t test. Note that 3β/3α-diol represents a mixture of 3β-diol and 3α-diol.

