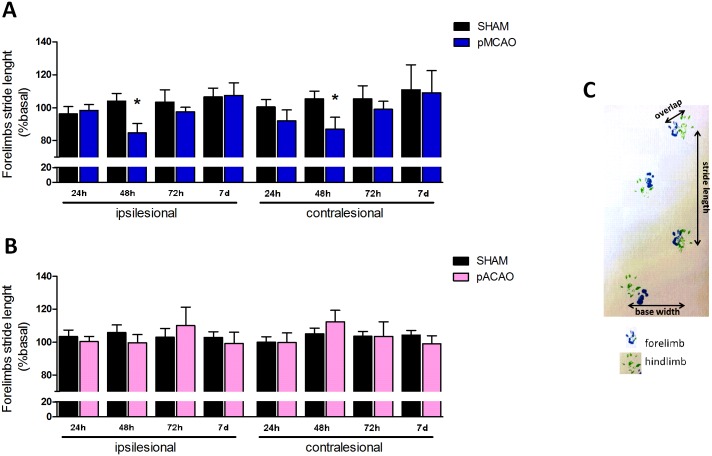
Fig 3. Footprint test after stroke.
Quantification of gait pattern 24 h, 48 h, 72 h and 7 d after surgery in sham-operated vs. pMCAO or pACAO mice. All data are expressed as percentage of each basal value. A. Distance of ipsilesional and contralesional forelimbs stride length measured in cm after pMCAO. B. Distance (cm) of footprint forelimbs stride length after pACAO C. Representative walking footprint patterns. Data are mean ± SD (n = 9–10; *P<0.05).

