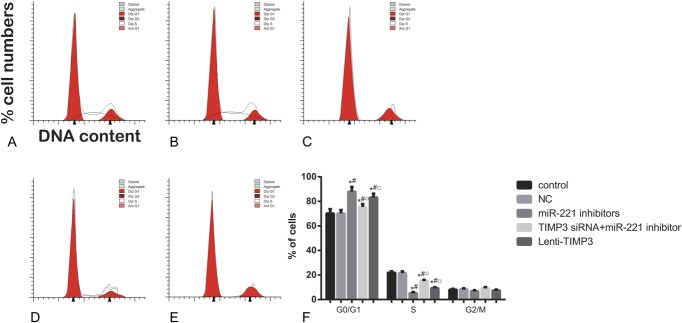
FIGURE 5.
Distributions of cell cycles for each group of cells assessed by flow cytometry. (A–E) Distribution of cell DNA contents in groups of control (A), NC (B), miRNA-221 inhibitors (C), siTIMP3+ miRNA-221 inhibitors (D), and Lenti-TIMP3 (E). (F) Percentage of cells distributed in each phase of cell cycle. Data were presented as mean ± SD for 3 independent experiments. *P < 0.05 vs control group, #P < 0.05 vs NC group, ○P < 0.05 vs inhibitors group, □P < 0.05 vs siRNA+inhibitors group.

