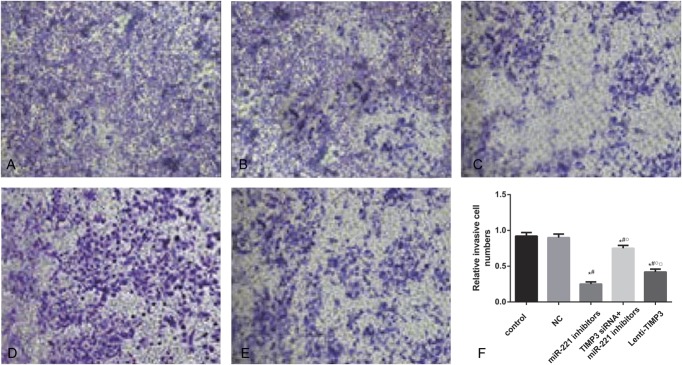
FIGURE 8.
Invasion abilities of cells estimated by transwell experiments. (A–E) Amounts of cells that penetrated the insert membrane in groups of control (A), NC (B), miRNA-221 inhibitors (C), siTIMP3+miRNA-221 inhibitors (D), and Lenti-TIMP3 (E). (F) Relative invasive rates of cells in each group. Data were presented as mean ± SD for 3 independent experiments. *P < 0.05 vs control group, #P < 0.05 vs NC group, ○P < 0.05 vs inhibitors group, □P < 0.05 vs siRNA+inhibitors group.

