Table 3.
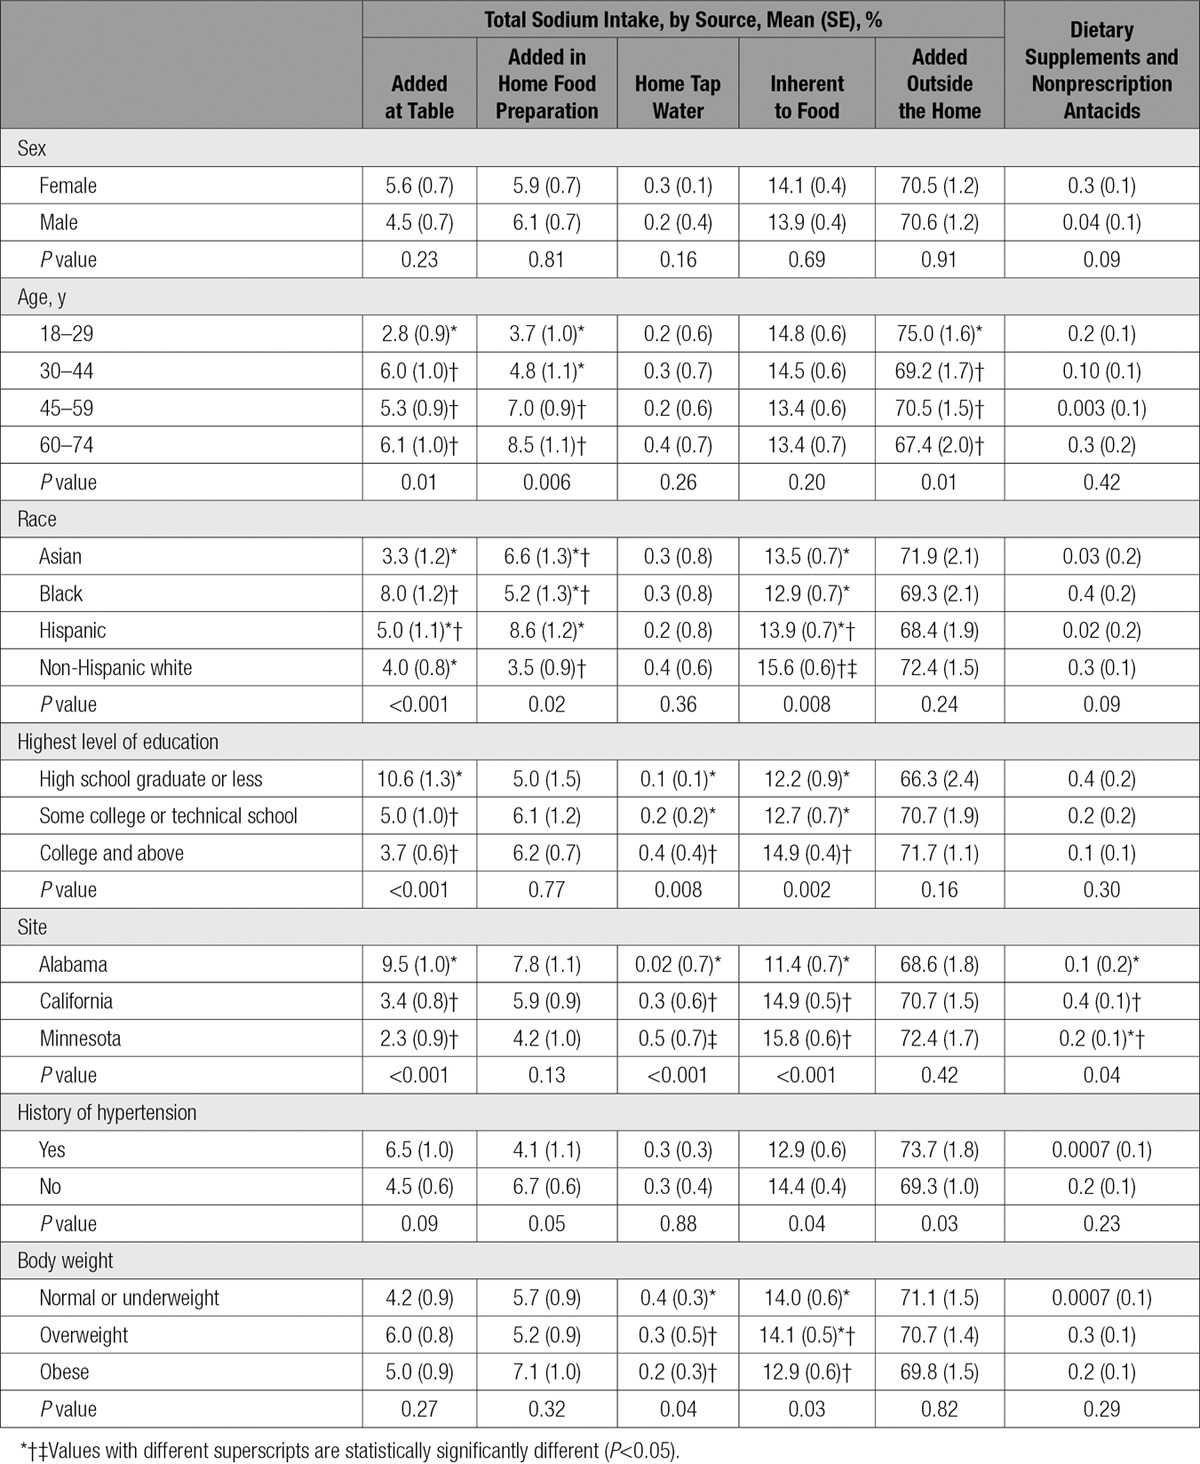
Proportion of Total Sodium Intake From Various Sources by Demographic and Health Characteristics Adjusted for Sex, Age, Race, and Site (n=450)

Proportion of Total Sodium Intake From Various Sources by Demographic and Health Characteristics Adjusted for Sex, Age, Race, and Site (n=450)
