
FIGURE 8.
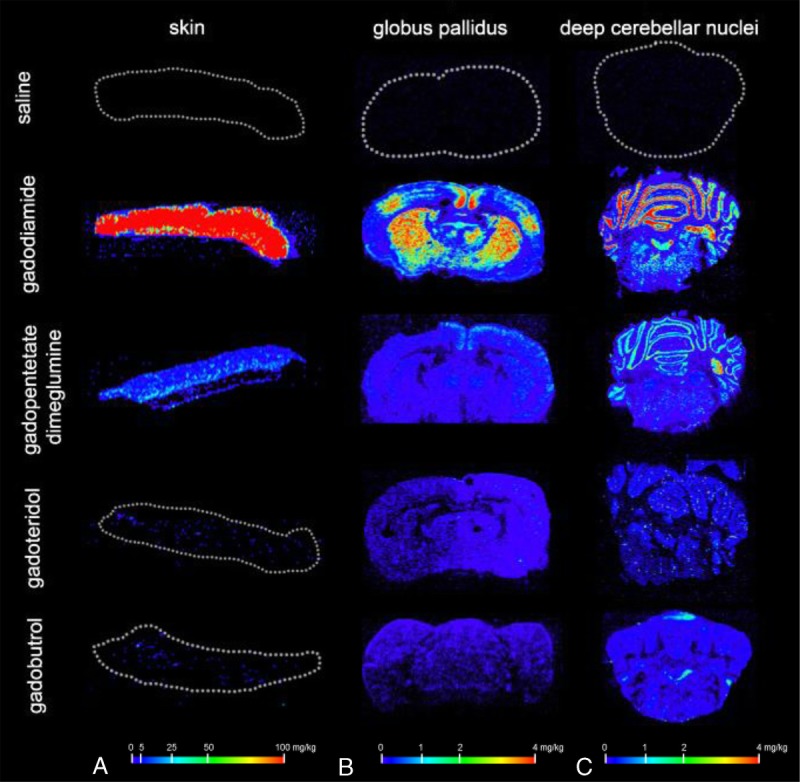
Tissue distribution after repeated high-dose administration of saline, gadodiamide, gadopentetate dimeglumine, gadobutrol, and gadoteridol measured using laser ablation ICP-MS. The highest Gd signals were detected in the (A) skin, (B) GP region, and (C) deep cerebellar nuclei region after the administration of the linear GBCAs gadodiamide and gadopentetate dimeglumine. In addition to the specific localization in the deep cerebellar nuclei, substantial Gd signals could also be visualized in other brain regions, such as the granular layer of the cerebellar cortex and in the facial nuclei in the pons. No local accumulation of Gd was observed within the deep cerebellar nuclei and the granular layer after the administration of macrocyclic gadobutrol and gadoteridol.