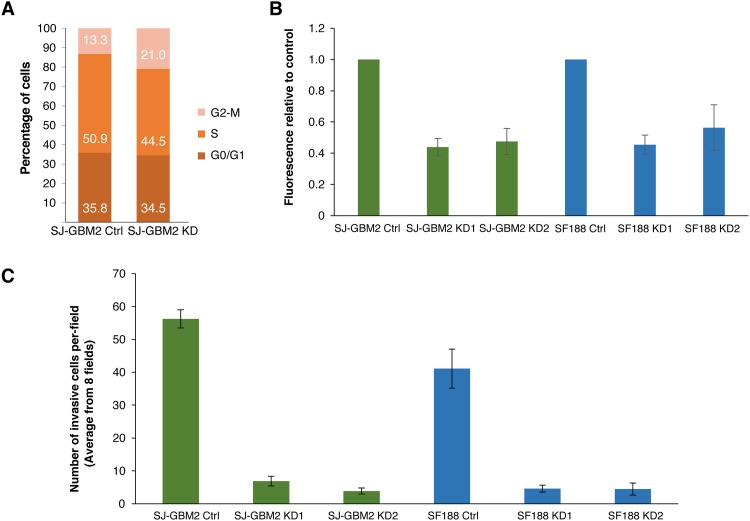
Fig 2. UCHL1 promotes cell proliferation and invasion.
A) Cell cycle distribution. UCHL1 depletion is associated with reduction on the percentage of SF188 cells in S phase (from 50.9% in the control to 44.5% in the KD) and a parallel increase in the fraction of cells on G2/M (from 13.3% to 21%). B) Soft agar growth. CytoSelect 96-Well Cell Transformation Assay, Soft Agar Colony Formation (Cell Biolabs) was used to assess anchorage independent growth. Cells were incubated for 10 days. On average, a 40–50% decrease in soft agar growth was observed in the UCHL1 knockdowns compared to control SJ-GBM2 and SF188 cells (P ≤ 0.05). Data are shown as mean ± SEM values (n = 3; performed in duplicates). C) Cell invasion was measured in control and UCHL1 knockdowns using CytoSelect 24-Well Assay (Cell Biolabs). The average number of invasive cells from eight fields after 24 hours of incubation is shown as mean values ± SEM (n = 3; performed in duplicates). At least a 7-fold decrease in cell invasiveness was observed in the knockdowns (P< 0.001). Per field, on average 56 (56.26 ± 2.77) control SJ-GBM2 cells were able to migrate through the Matrigel substrate, whereas only ~7 (6.9 ± 1.46) and ~4 (3.9 ± 0.912) were able to invade in the knockdowns. Similar results were observed in the case of SF188 glioma cell with the number of invasive cells dropping from ~40 (41.12 ± 5.94) in the controls to ~5 in the knockdowns (4.6 ± 1.051 and 4.5 ± 1.82 for KD1 and KD2 respectively).

