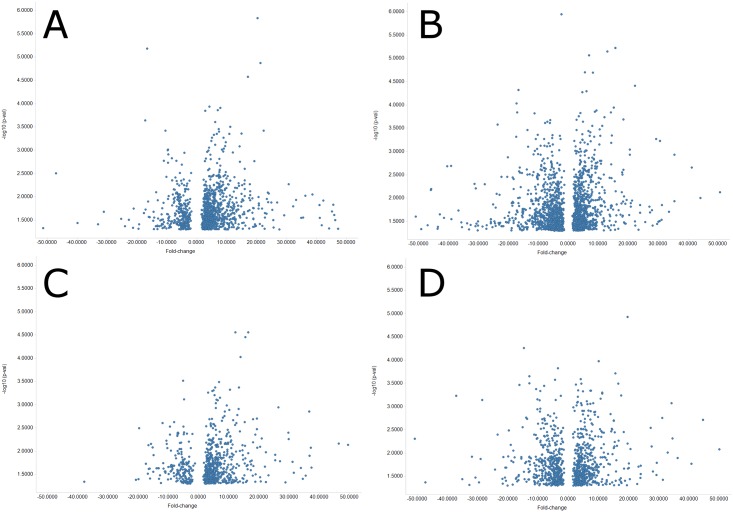
Fig 1. Volcano plot of LINE and LTR elements.
Panels A and B show fold-change versus -log10 of p-value of LINE elements which show significant change in the respective strains. Panels C and D show fold-change versus -log10 of p-value for the LTR elements. Panels A and C show elements significantly changed in the C3H/HeJ strain while panels B and C show elements from the C57BL/6 strain. Panels were clipped at plus/minus 50X fold-change for clarity resulting in 15, 14, 4, & 5 outliers not being shown on panels A, B, C, & D respectively. Unclipped figures are available in the supplementary files (S1 Excel File).

