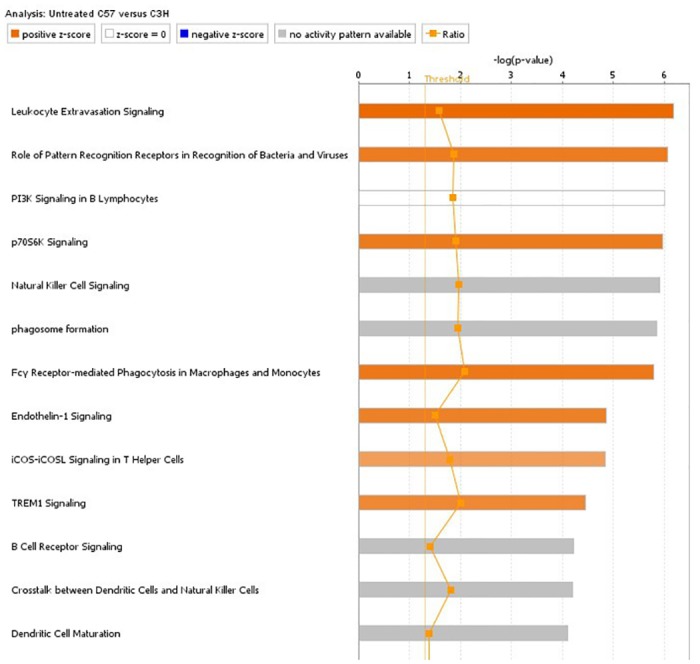
Fig 3. Ingenuity pathway analysis of genes differentially expressed between untreated C57BL/6 and C3H/HeJ samples.

Bar length is proportional to -log10 of p-value. Orange color indicates activation of the pathway, blue indicates suppression of the pathway and grey indicates a mixed response.
