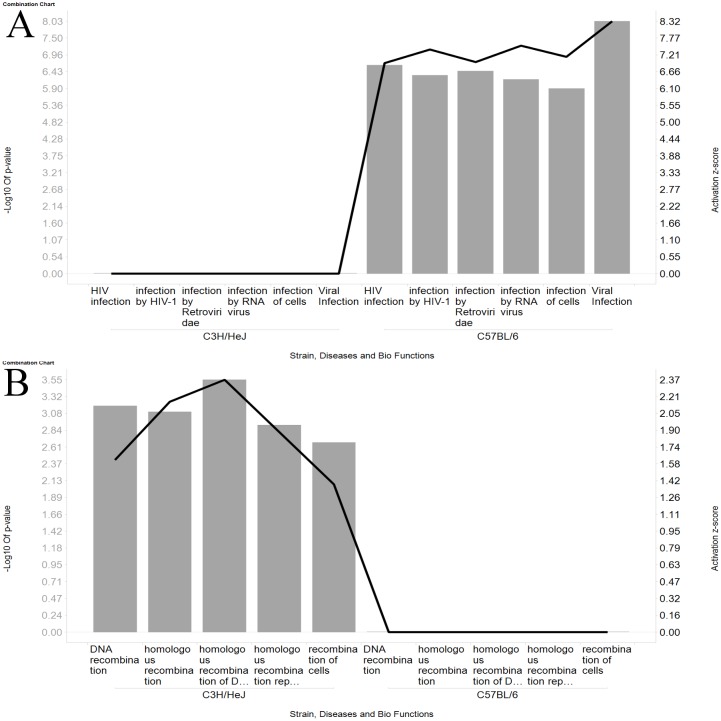
Fig 4. Ingenuity biofunction analysis results for selected categories.
The gray bars are proportional to the -log10 of the function p-values and the black line indicates the Activation z-scores. Results compare the functions predicted for WY-14,643 treatment of the C3H/HeJ animals with the treatment of the C57BL/6 animals. Panel A compares several of the most significant viral biofunctions identified by Ingenuity’s Bio & Tox Function analysis. Panel B compares the significant biofunctions related to recombination in the chromosomes.

