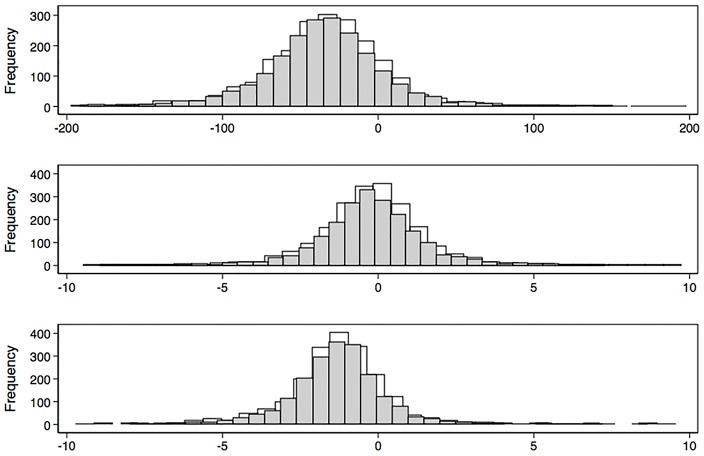
Fig 1. Distribution of pre-bronchodilator (preBD) (gray bars) and post-bronchodilator (postBD) (light bars) Forced Expiratory Volume in the first second (FEV1) in mL/y (upper graph); as percentage of predicted (%P, middle graph); and as percentage of baseline (lower graph).
Decline varied considerably regardless of in which units is expressed, including individuals with no decline or increase in measurements from baseline.

