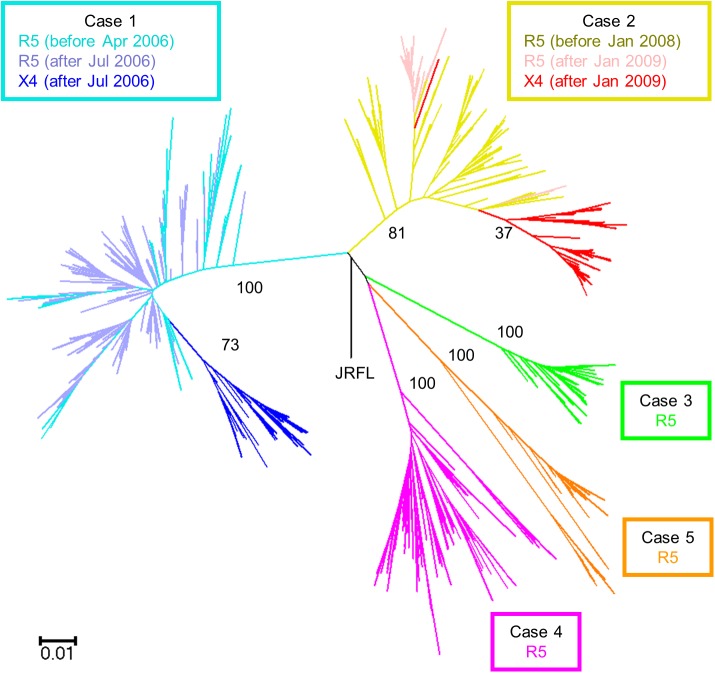
Fig 4. Phylogenetic analysis of deep sequencing using 345 bp (position in HXB2: 6970–7314) around the V3 region of HIV-1 env in five hemophiliac HIV-1 slow progressors.
Phylogenetic tree was constructed using the neighbor-joining method and the Kimura 2-parameter model with HIV-1 JRFL sequence as an out-group. The R5 sequences before and after the emergence of X4 variants are shown for Case 1 in light-blue and purple, respectively, while the X4 sequences are shown in dark-blue. R5 sequences before and after the emergence of X4 variants are shown for Case 2 in yellow and pink, respectively, while the X4 sequences are shown in red. The sequences of Cases 3, 4, and 5 are shown in green, orange, and magenta, respectively. Numbers represent bootstrap values.

