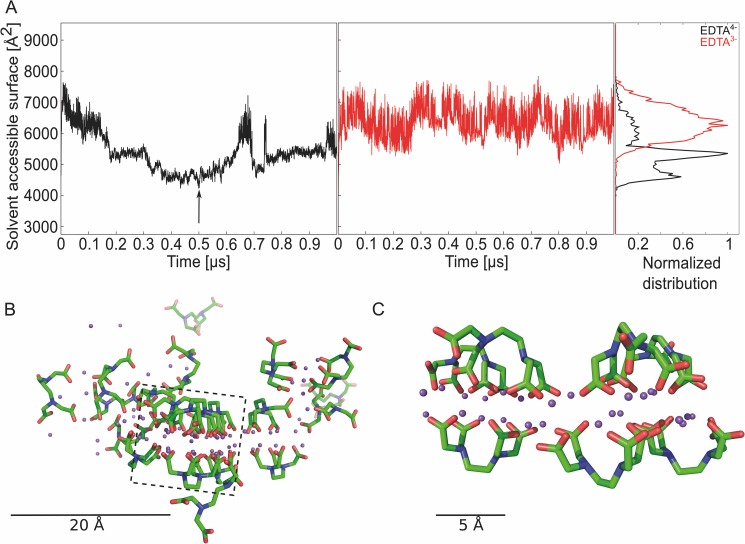
Fig 3. MD simulations to investigate EDTA aggregation and interaction with SYPRO Orange.
(A) SASA and frequency distribution of the SASA over all 20 EDTA molecules in the simulation box; EDTA4- (black), EDTA3- (red), the arrow shows which snapshot was used to visualize the EDTA aggregate. (B) Snapshot of an MD trajectory showing an EDTA4—Na+ aggregate; the snapshot was taken at 500 ns (see arrow in panel A); EDTA4-: green: C atoms, blue: N atoms, red: O atoms; magenta: Na+ ions. Box: This part of the image was zoomed to get a better view on the bilayer within the aggregate. For clarity, some EDTA molecules in front of the bilayer were discarded. (C) Zoomed view on an EDTA4—Na+ aggregate showing a bilayer formation.

