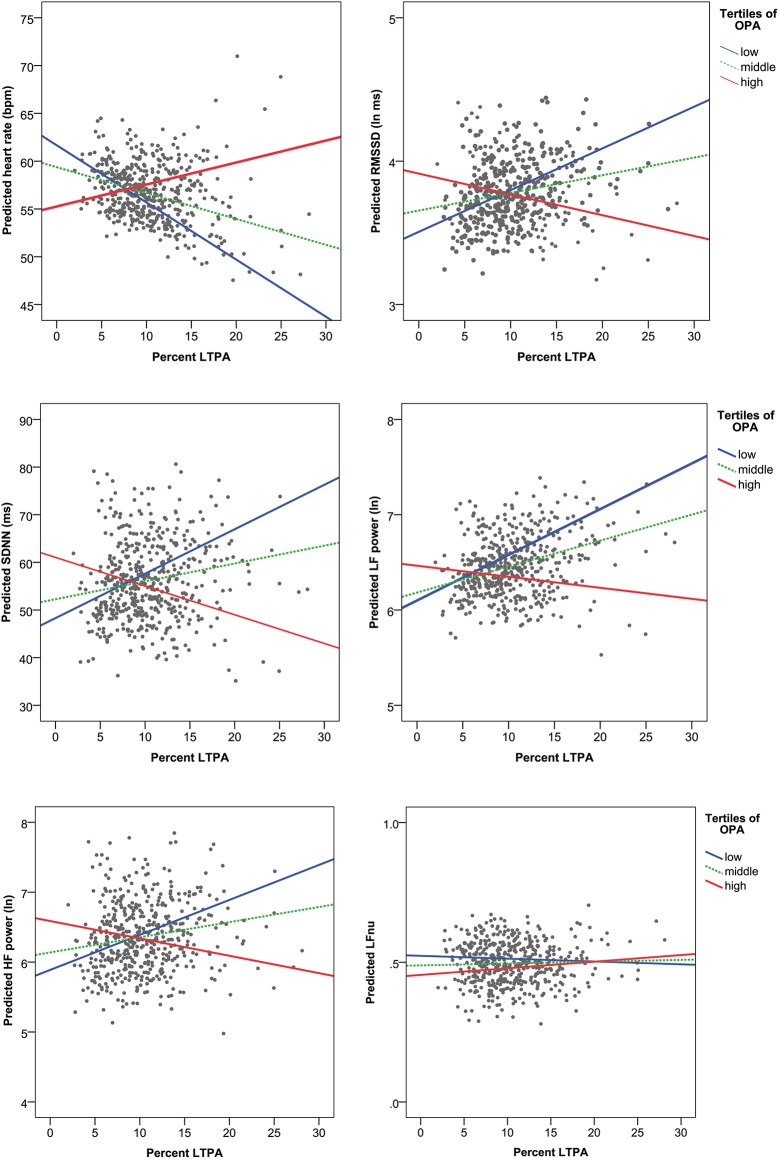
Fig 1. Predicted nocturnal heart rate and heart rate variability indices from the multiple regression analyses adjusted for age, gender, body-mass index and smoking.
The x-axes represent percent time in leisure-time physical activity (LTPA), and the lines represent tertiles (low, middle and high) of occupational physical activity (OPA).

