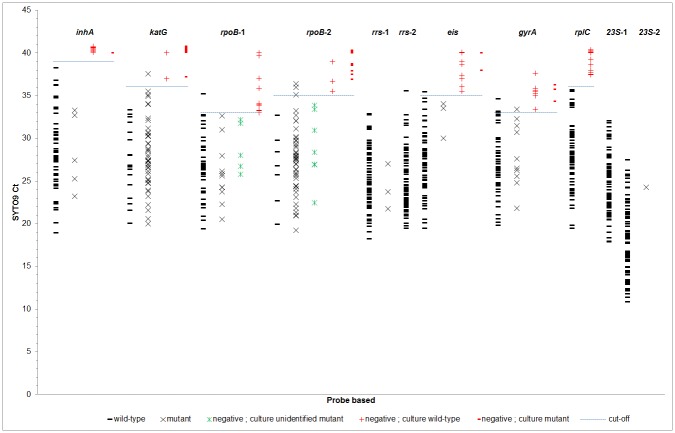
Fig 2. Amplification Ct cut-off.
For each of 71 sputum samples the average SYTO9 Ct value for each of the 11 amplicons is shown. Average Ct are organized according to whether the sputum probe result was wild-type (black -), mutant (black x), or negative. Sputum probe negative results are further stratified into whether the cultured isolate was found to be wild-type (red +), mutant (red -), or to possess an “other” mutation (green X). ROC analysis was performed to examine the optimal Ct whereby SYTO9 to interpret the probe results.

