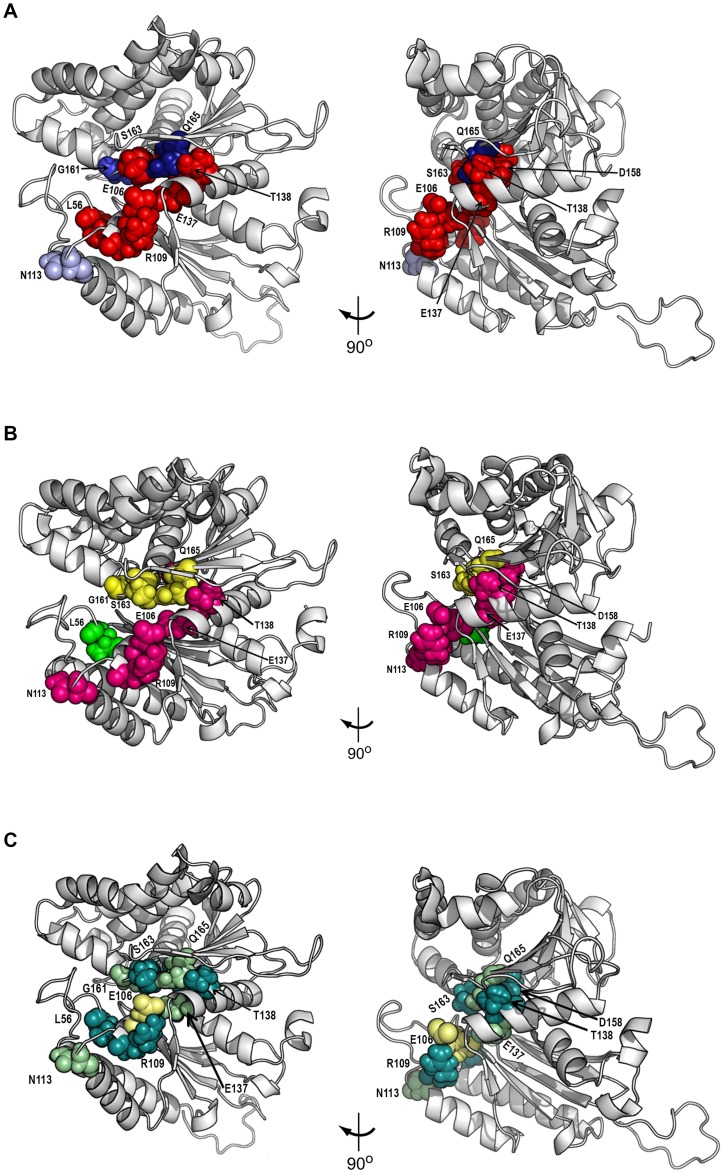
Fig 8. Functional mapping of Rtg2p residues involved in retrograde signaling and aging.
(A) Retrograde signaling determinants map. This map reflects the gene expression of the reporter CIT2-LacZ in the mutant strains grown on YNBD. Red color represents the residues whose β-galactosidase activity was similar to the rtg2Δ strain, in which the retrograde response is not activated. Blue color shades indicates the expression observed in RTG2-N113A, RTG2-G161A and RTG2-Q165A mutants that show, respectively 21, 32 and 65% of the wild type expression (the darker blue the higher the level of gene expression). (B) Map of Rtg2p lifespan determinants identified with RTG2 point mutants grown on YPD. N-terminal Rtg2p mutants are divided into three different groups in respect to their longevity phenotype. Mutants showing longevity similar to the wild type are shown in yellow, those similar to rtg2Δ in magenta and the long-lived mutants in green. (C) Map of Rtg2p lifespan determinants found in RTG2 ρ0 point mutants grown on YPR. N-terminal Rtg2p mutants are divided into two different groups in respect to their longevity phenotype. Mutants showing longevity similar to the WT ρ0 are shown in deepteal, those whose RLS was markedly increased are in palegreen; and in paleyellow; the residue E106 whose mutations are in both groups (E106H is long-lived whereas Q165E is short-lived). Residues are displayed in space filling representation and left panels are the same model as right panels rotated 90°clockwise around y axis.

