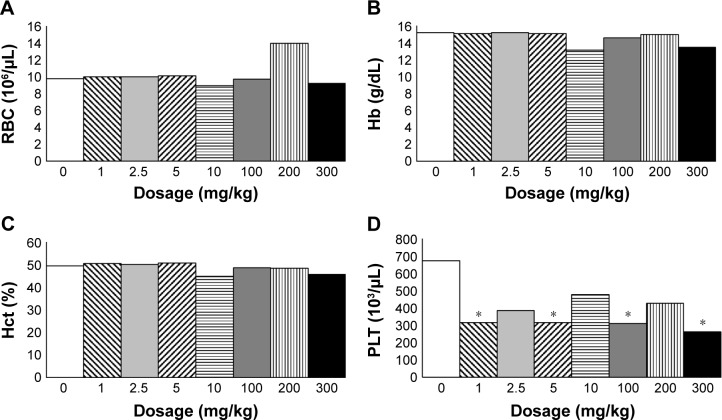
Figure 2.
Hemogram of RBCs and PLTs.
Notes: Hemogram at 14 days after the injection of SiNPs: (A) RBC count, (B) Hb, (C) Hct, and (D) PLT count. *P<0.05 when compared with control group, 0 mg/kg.
Abbreviations: Hb, hemoglobin; Hct, hematocrit; PLT, platelet; RBC, red blood cell; SiNPs, silica nanoparticles.

