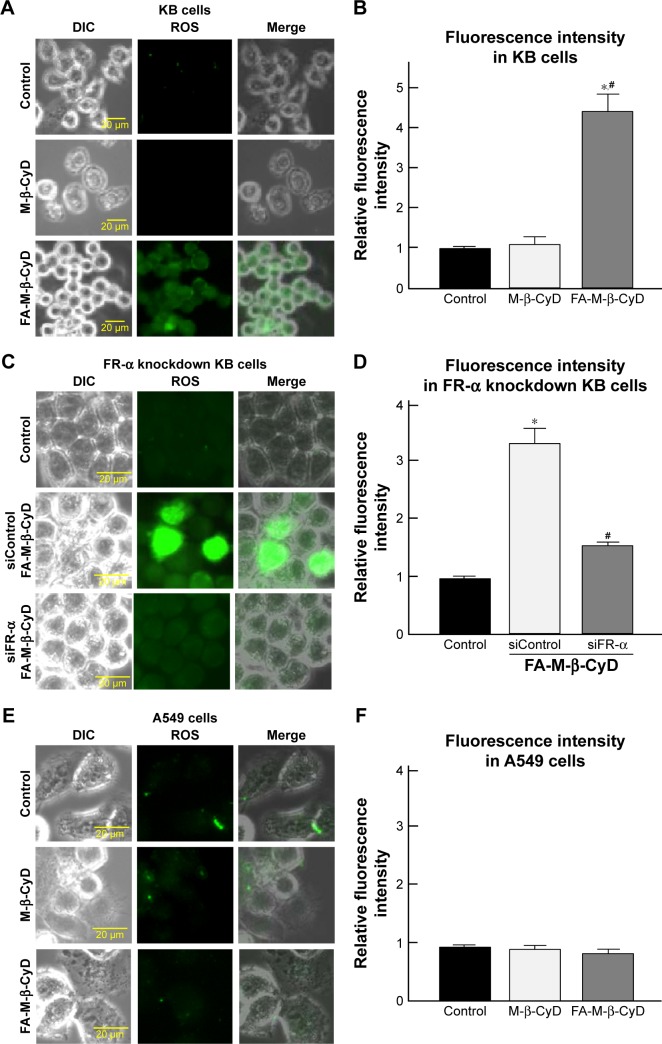
Figure 4.
Effects of FA-M-β-CyD on ROS production.
Notes: KB cells (A, B), FR-α-knockdowned KB cells (C, D), and A549 cells (E, F) were incubated with 5 mM M-β-CyDs and ROS detection reagent for 2 h. (B, D, F) The fluorescence intensities determined by BZ-II analyzer. Bar graphs represent mean ± SEM (n=3 per group). Significant difference with P<0.05 as compared to *control and #M-β-CyD.
Abbreviations: DIC, differential interference contrast; FR, folate receptor; ROS, reactive oxygen species; SEM, standard error of the mean.

