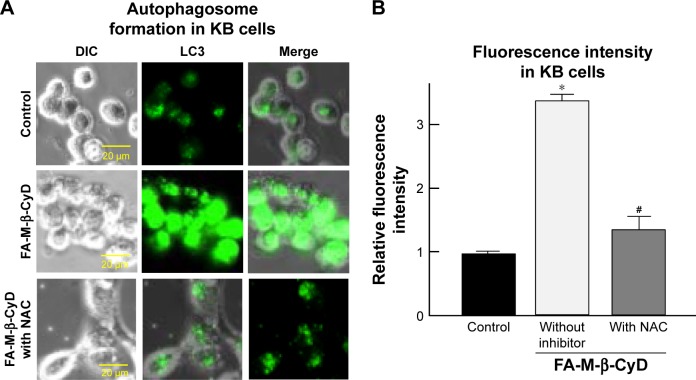
Figure 5.
Effect of ROS inhibitor on autophagosome formation induced by FA-M-β-CyD.
Notes: (A) KB cells were treated with 5 mM FA-M-β-CyD and 100 µM NAC for 2 h. Then, cells were treated with Cyto-ID for 30 min. (B) The fluorescence intensities determined by BZ-II analyzer. Bar graphs represent mean ± SEM (n=3 per group). Significant difference with P<0.05 as compared to *control and #FA-M-β-CyD without inhibitor.
Abbreviations: DIC, differential interference contrast; NAC, N-acetyl-l-cysteine; ROS, reactive oxygen species; SEM, standard error of the mean.

