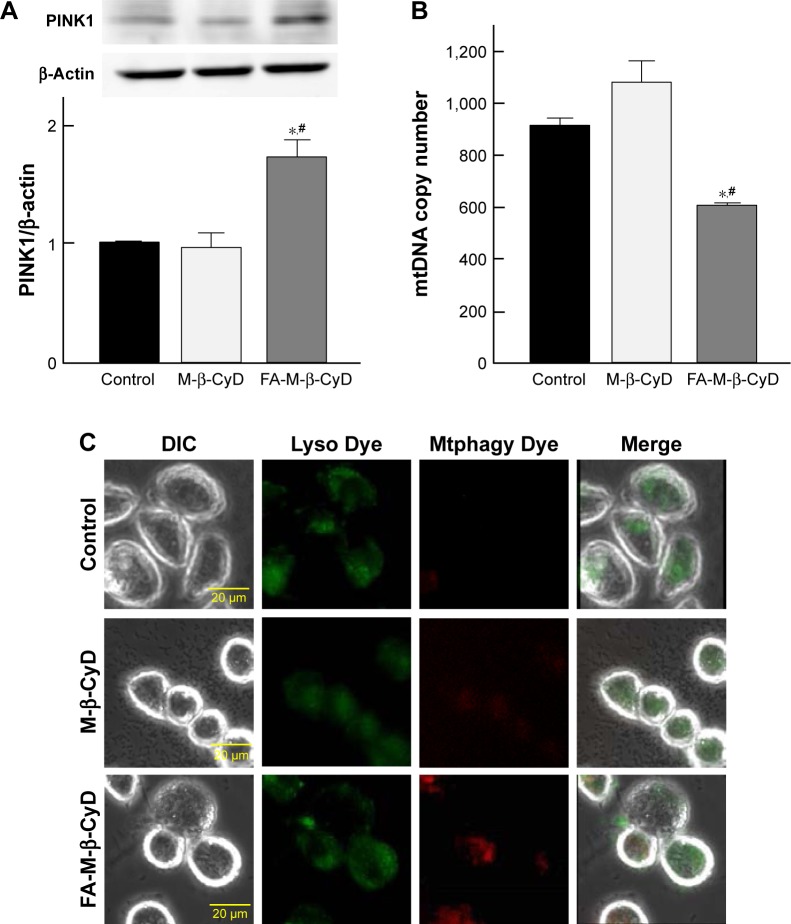
Figure 7.
Induction of mitophagy by FA-M-β-CyD.
Notes: (A) Effects of FA-M-β-CyD on expression of PINK1 in KB cells after incubation with 5 mM M-β-CyDs for 2 h. The PINK1 protein level was detected by Western blotting. The representative blots were indicated (n=3). (B) Effects of FA-M-β-CyD on mtDNA copy number in KB cells after incubation with 5 mM M-β-CyDs for 2 h. The mtDNA was quantified by real-time PCR. Bar graphs represent mean ± SEM (n=3–4 per group). Significant difference with P<0.05 as compared to *control and #M-β-CyD. (C) Detection of mitophagy in KB cells. The cells were treated with Mtphagy Dye, a mitophagy detection reagent, for 15 min. The cells were then incubated with 5 mM M-β-CyDs for 2 h and then Lyso Dye, a lysosome detection reagent, for 10 min. The representative images are shown (n=3).
Abbreviations: DIC, differential interference contrast; mtDNA, mitochondrial DNA; PCR, polymerase chain reaction; PINK1, PTEN-induced putative kinase; SEM, standard error of the mean.

