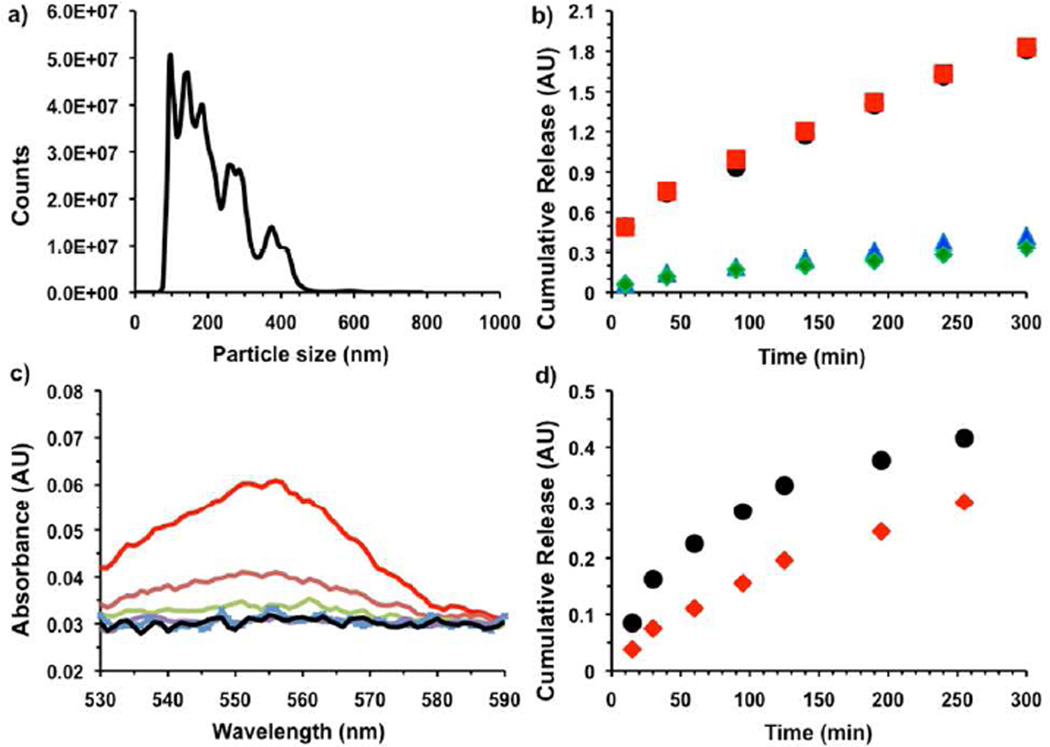
Figure 2.
a) Size histogram of Rhodamine B encapsulated nanoparticles as measured by Nanoparticle Tracking Analysis. b) Cumulative release of Rhodamine B from encapsulated nanoparticles with time at different pH. (black-pH 7.4 PBS), (red-pH 7.0 MBS), (blue-pH 5.3, MBS) and (green-pH 1.7 PBS). c) Release of Rhodamine B from encapsulated nanoparticles in presence of KO2 after 20 min incubation time. (black- No KO2), (red- 1 × 10⁻² M KO2), (brown- 1 × 10⁻³ M KO2), (light green- 1 × 10⁻⁴ M KO2), (violet- 1 × 10⁻⁵ M KO2) and (light blue- 1 × 10⁻⁶ M KO2), in pH 5 (MBS buffer). d) Cumulative release of Rhodamine B from encapsulated nanoparticles with time in presence of KO2 (black- 1 × 10⁻³ M KO2), (red- 1 × 10⁻⁴ M KO2) in pH 5 (MBS buffer).

