
Figure 5. Screening of a Kinase Inhibitor Library against Cell Lines Expressing nAChR.
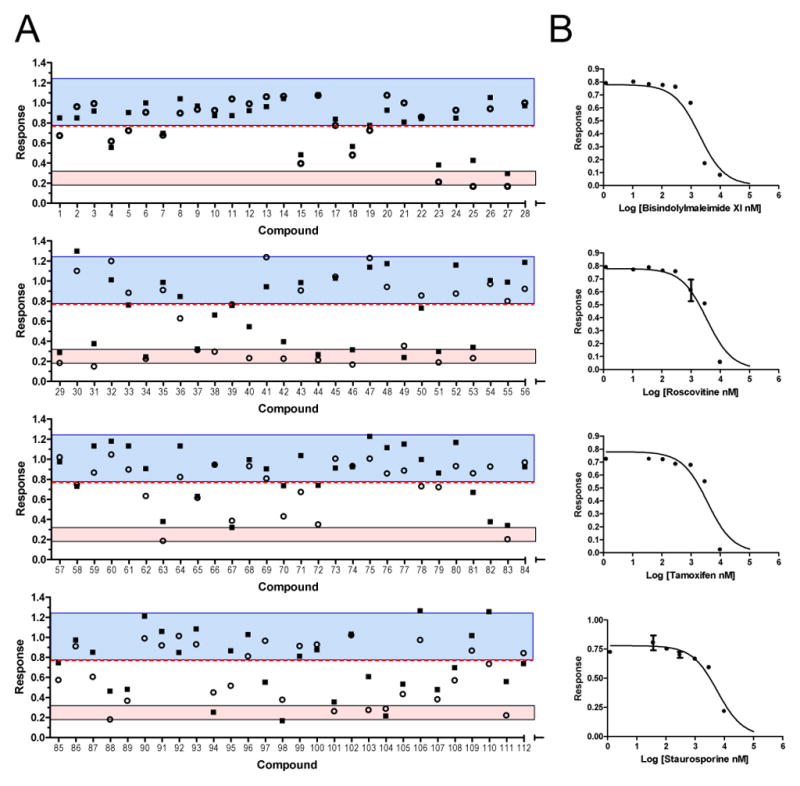
A. Cells were treated with 20 μM nicotine in the presence of 12.5 μM library compound and analyzed in the aequorin calcium assay as described above. The blue shaded area represents compounds lying within three standard deviations of the normalized mean response in the presence of nicotine plus vehicle (compounds 22, 24, 26, 28, 30, 32; mean ± std/1.00±0.07, n = 12). The red shaded area represents compounds within the 95% confidence interval of the nAChR antagonist mecamylamine (compounds 23, 25, 27, 29, 31; mean ± std/0.26±0.02, n=10). The square and circular points represent the results of two independent assays. Data were analyzed using GraphPad Prism ver. 5. B. The four panels are representative dose responses for triplicate wells in the primary calcium assay of a subset of hits from the primary screen that were chosen as controls for validation purposes. The IC50s for the 95% confidence intervals were: bisindolylmaleimide XI (0.81 to 3.1 μM), roscovitine (2.3 to 6.2 μM), tamoxifen (2.5 to 7.9 μM), and staurosporine (2.2 to 6.8 μM) (N = 3).