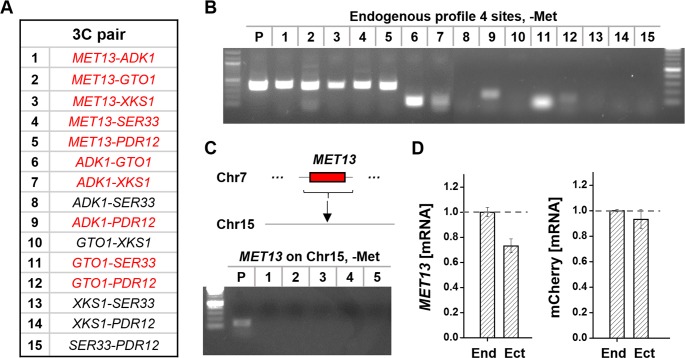
Fig 6. Long-distance interaction and gene regulation of the native profile 4 sites.
A) A list of the 3C pairs between the native profile 4 sites. B) 3C assay between the gene pairs in A. The pairs with positive signals are labeled red in A. C) 3C assay between MET13 and the rest of the profile 4 sites after translocation to Chr15. No interaction was detected at this new location. D) MET13 expression measured by RT-PCR at the endogenous (End) or ectopic (Ect) location. The MET13 mRNA level is significantly reduced on Chr15 (p-value < 0.001). The expression of the control (mCherry driven by MET13pr at CDC20 locus) is unchanged.

