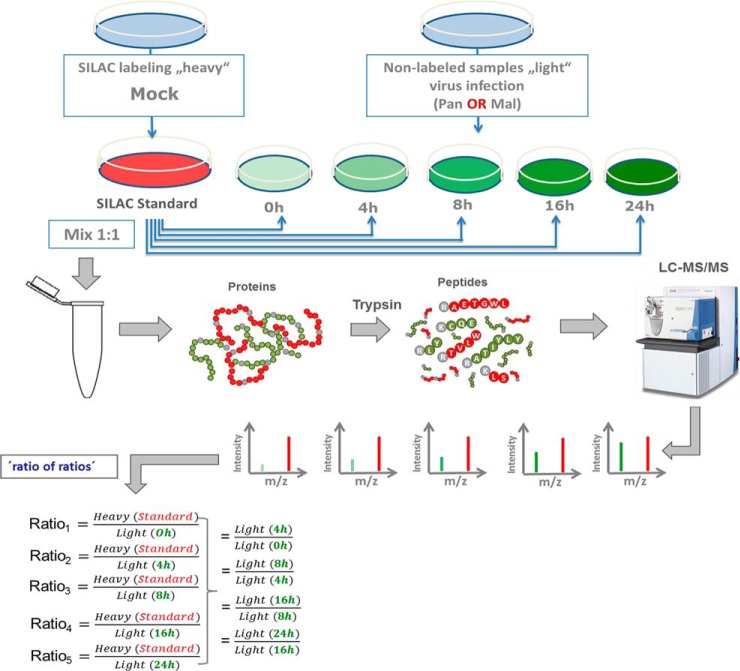
Fig. 2.
Schematic representation of “spike-in SILAC” approach. R10K8-labeled A549 cells were mock infected generating the “SILAC standard.” R0K0 cells were infected with either Pan or Mal virus (MOI 2) for the indicated time points. Same amounts of proteins were mixed and prepared for measurement by a Q Exactive™ Orbitrap (Thermo Scientific™) equipped with a Nano-LC. The ratio of peak intensities from the heavy and light peptides display the abundance of the corresponding proteins. MS data were acquired using Xcalibur software and searched using the Andromeda algorithm in Maxquant 1.5.1.2 against the Homo Sapiens (ncbi) database (89,601 entries). Spiking of light cell populations with “SILAC standard” enables indirect comparison of light samples; n = 2.

