Fig. 3.

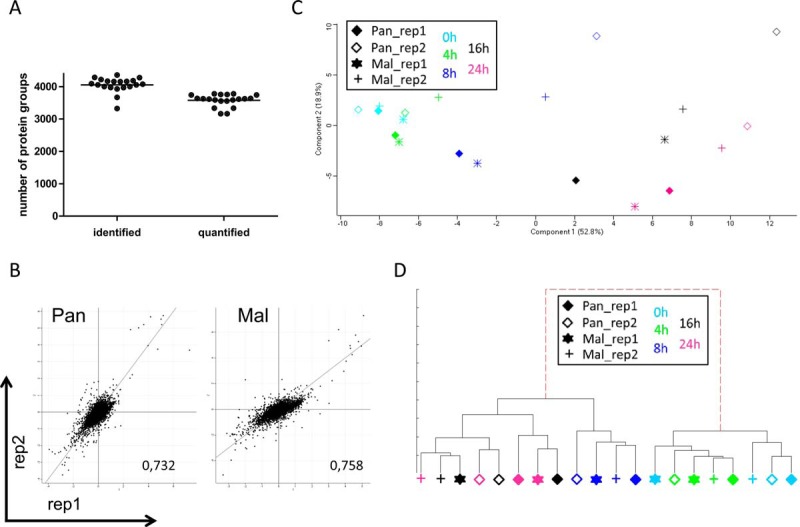
MS data evaluation revealed quantification of about 3,500 proteins per sample with good correlation between replicates and time points. A, MS data were acquired using Xcalibur software and searched using the Andromeda algorithm in Maxquant 1.5.1.2 against the Homo Sapiens (ncbi) database (2014–4; 89,601 protein sequences). Evaluation in Perseus 1.5.0.31 identified about 4000 protein groups per sample of which 3500 were used for protein quantification. B, Scatter plot analysis of biological replicates at 24 h p.i. Displayed are log2(L/H) values of Pan (left panel) and Mal (right panel) infected cells and the corresponding Pearson correlation; dots represent protein groups. C, Principle component analysis using Perseus 1.5.0.31 and 944 significant proteins (p < 0.05) having valid values in each sample to determine structure and variance of MS data. D, Hierarchical cluster analysis by means of IDAS 2.1 (34) using 85 proteins having significant log2(fold changes) >1 or <−1 and valid values in each sample. C–D: Each symbol represents one sample: filled diamond - Pan infected cells, replicate 1; diamond - Pan infected cells, replicate 2; star - Mal infected cells, replicate 1; cross - Mal infected cells, replicate 2; light blue - 0 h p.i.; green - 4 h p.i.; dark blue - 8 h p.i.; black - 16 h p.i.; pink - 24 h p.i.
