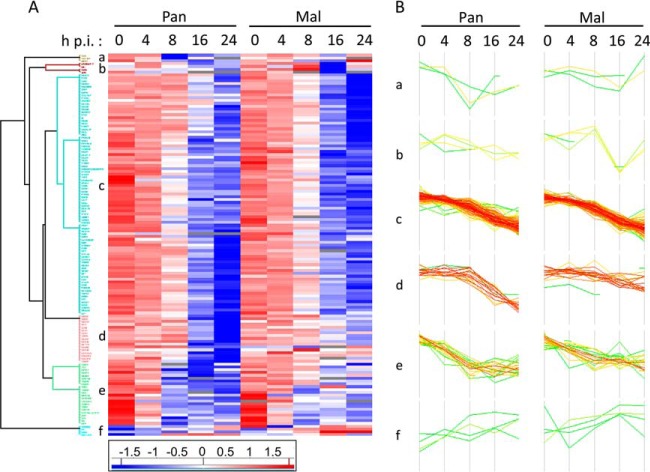
Fig. 5.
Cluster analysis of protein expression pattern during the course of IAV infection. A, Hierarchical cluster analysis based on protein expression pattern over time generated by means of Perseus software version 1.5.0.31. Used were the Z-scores of 135 identified proteins with significant log2(fold changes) >1 or <−1 (p value< 0.05) and a Euclidean distance threshold of 1.9. B, Profile plots a-f illustrate the expression patterns of distinct clusters in A.

