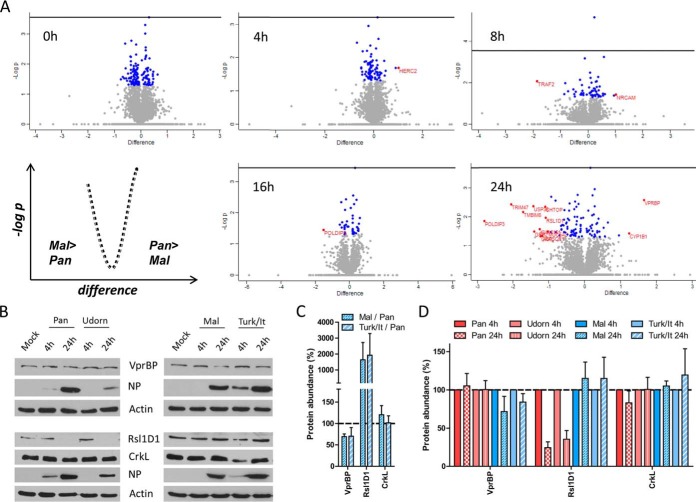
Fig. 6.
Identification of protein signatures during permissive versus nonpermissive IAV infection. A, Volcano plot analyses display the changes in protein abundance due to permissive (Pan) versus nonpermissive (Mal) IAV infection at the indicated time points: differences between L/H ratio of two samples were plotted against -log(p value); blue: log2(fold change) <1 or >−1, p value<0.05; red: log2(fold change) >1 or <−1, p value<0.05; t test, n = 2. B, A549 cells were infected with indicated viruses at an MOI of 2 (VprBP) or 3 (CrkL, Rsl1D1), respectively. At 4 h and 24 h p.i. cell lysates were prepared in 1% SDS buffer. Protein expression levels were analyzed by SDS-PAGE and immunoblot. Data from one representative experiment of at least three are shown. C, Band intensities of VprBP, Rsl1D1 and CrkL proteins at the 24 h time point post Mal virus or Turk/It virus infection were quantified, normalized to actin levels and displayed in relation to the protein expression levels at 24 h Pan virus infection; n ≥ 3. D, Band intensities of VprBP, Rsl1D1 and CrkL proteins at 24 h p.i. with the indicated viruses were quantified, normalized to actin levels and displayed in relation to the protein expression levels at 4 h p.i.; n ≥ 3.

