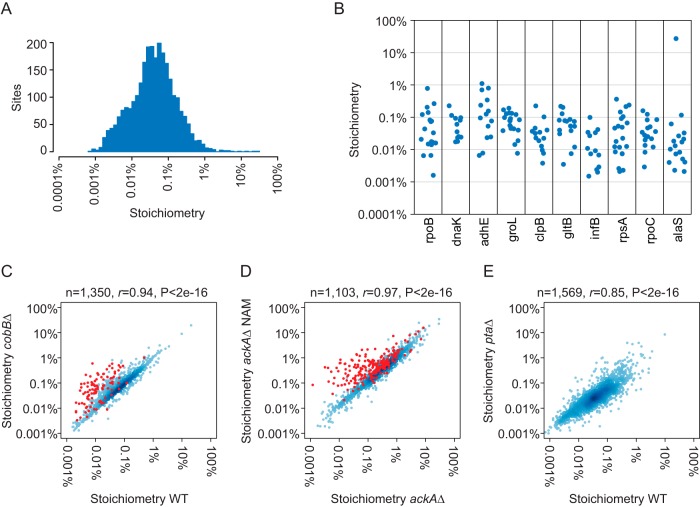
Fig. 3.
Acetylation site stoichiometry in E. coli. A, The histogram shows the distribution of acetylation site stoichiometry in WT EP cells (n = 2700). B, The category scatterplot shows the distributions of acetylation site stoichiometry for the indicated proteins in WT EP cells. C, The scatterplot shows the correlation between acetylation stoichiometry in WT and cobBΔ cells. CobB-regulated sites (as defined by SILAC quantification (12)) are shown in red and were excluded from the Pearson's correlation. The number of sites analyzed (n), Pearson's correlation (r), and p value (P) of correlation is shown. D, The scatterplot shows the correlation between acetylation stoichiometry in ackAΔ and nicotinamide (NAM)-treated ackAΔ cells. CobB-regulated sites (as defined by a stoichiometry ratio cobBΔ/WT >2) are shown in red and were excluded from the Pearson's correlation. E, The scatterplot shows the correlation between acetylation stoichiometry in WT and ptaΔ cells.

