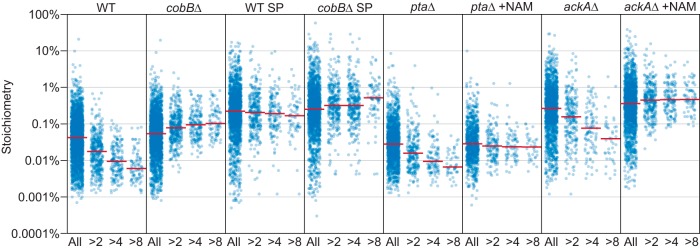
Fig. 4.
Acetylation stoichiometry at CobB-regulated sites. The category scatterplot shows the distributions of acetylation site stoichiometry for the indicated experiments. WT = wild type, EP = exponential phase, SP = stationary phase, NAM = nicotinamide, and knock out (Δ) strains are as indicated. Sites that are more than 2-fold (>2), 4-fold (>4), or 8-fold (>8) increased in the absence of CobB (during EP growth) are indicated. The median of the distributions are indicated by the red lines.

