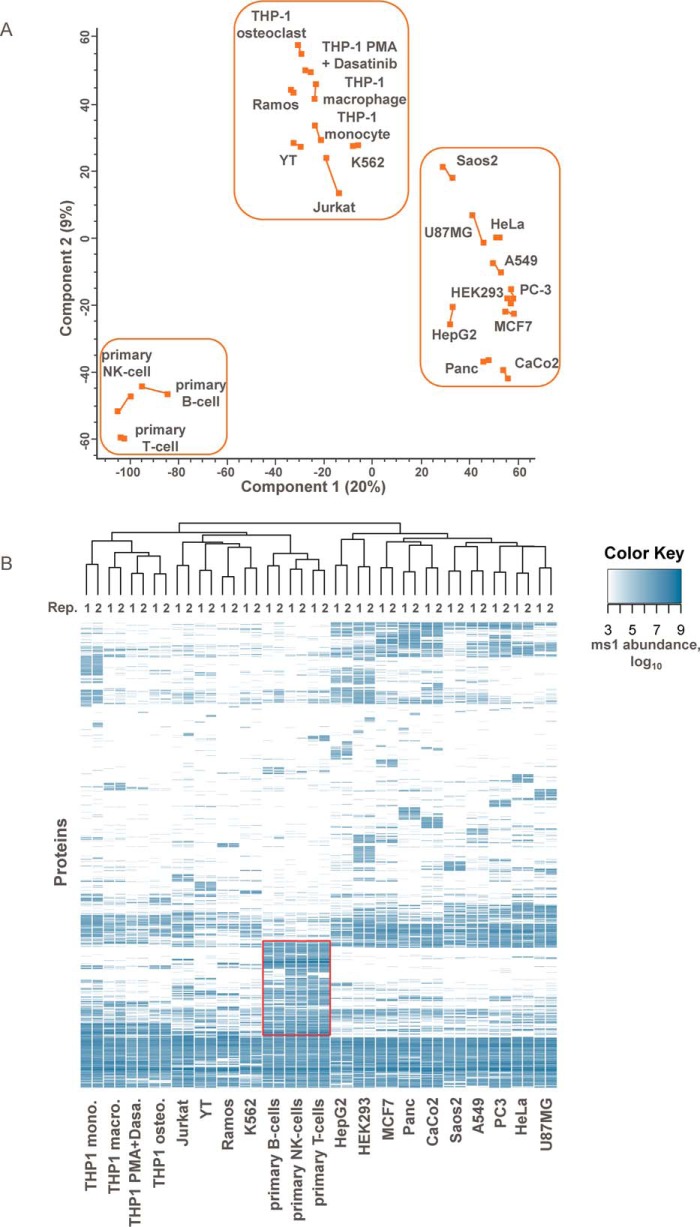
Fig. 2.
Comparison of plasma membrane proteomes of cell lines and primary cells. A, principal component analysis of cell line and primary cell-surface proteomes in two biological replicates. The first two principal components account for 29% of the total variation. Axes are labeled with the percent total variance of the corresponding principal component. Biological replicates are connected by lines. Epithelial, lymphoblastic, and primary cells are grouped in boxes. B, heat map representation of the cell-surface proteomes based on protein class abundances (Top3 method) and average linkage clustering using a Euclidian distance matrix.

