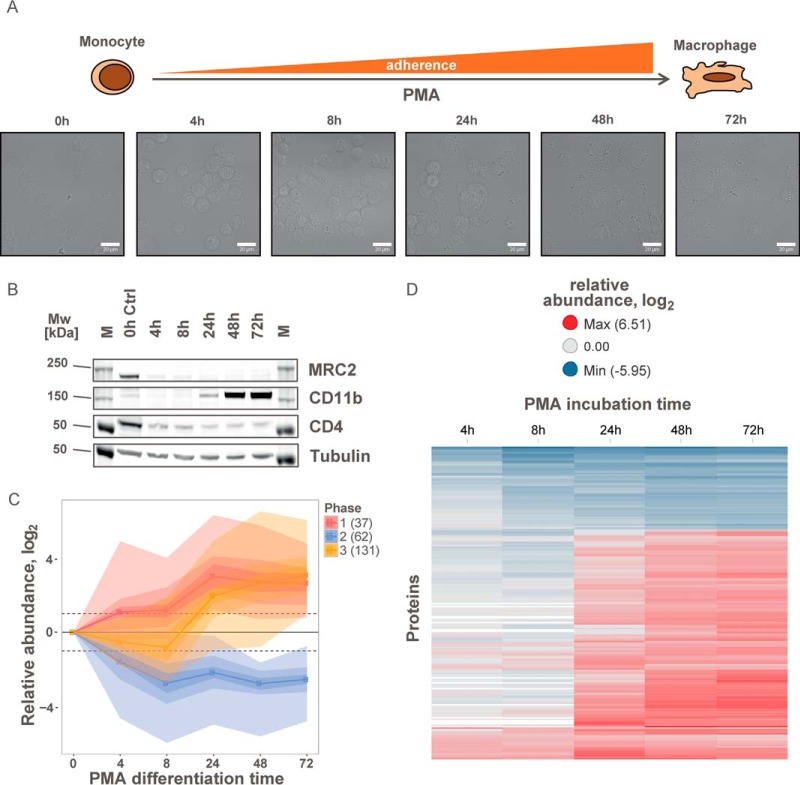
Fig. 4.
Time-dependent monitoring of the plasma membrane proteome during differentiation of THP-1 cells. A, morphological changes of suspension monocytic THP-1 cells to adherent macrophage-like cells during differentiation in the presence of 100 nm PMA monitored by light microscopy. B, immunoblot of regulated cell-surface markers during differentiation of monocytic THP-1 cells to macrophage-like cells by PMA (M: molecular weight marker). C, abundance changes of significantly regulated plasma membrane proteins during differentiation grouped into three phases. Color shadings indicate data density. The numbers of proteins in each cluster are indicated. D, heat map of relative abundances for significantly regulated plasma membrane proteins during differentiation. See also supplemental Fig. S3.

