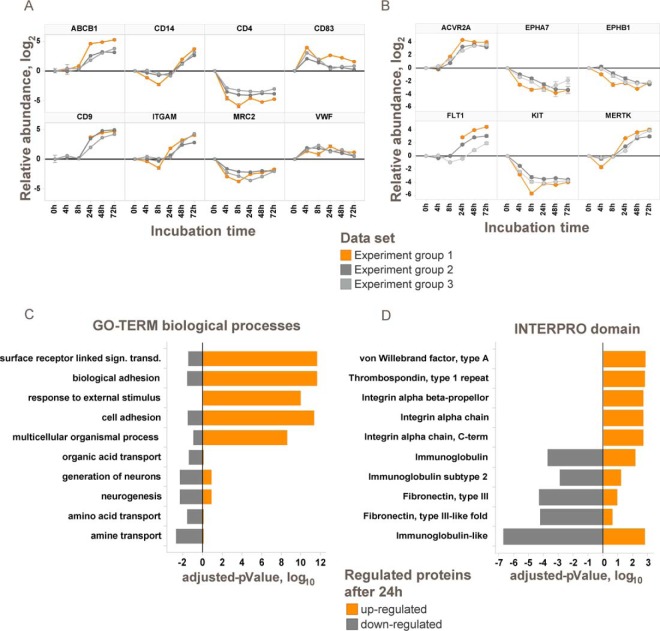
Fig. 5.
Changes on the THP-1 cell-surface proteome during differentiation with PMA reflect differences between monocyte and macrophage functions. A, examples for significantly regulated proteins. Log2 transformed abundance changes relative to 0 h are shown for three independent experiments. B, examples for significantly regulated plasma membrane-associated kinases. C, GO-Term enrichment analysis of up- and down-regulated proteins after 72 h. Bars indicate logarithmic Benjamini-Hochberg corrected p values. D, INTERPRO domain enrichment analysis of up- and down-regulated proteins after 72 h. Bars indicate logarithmic Benjamini-Hochberg corrected p values. See also supplemental Fig. S3.

