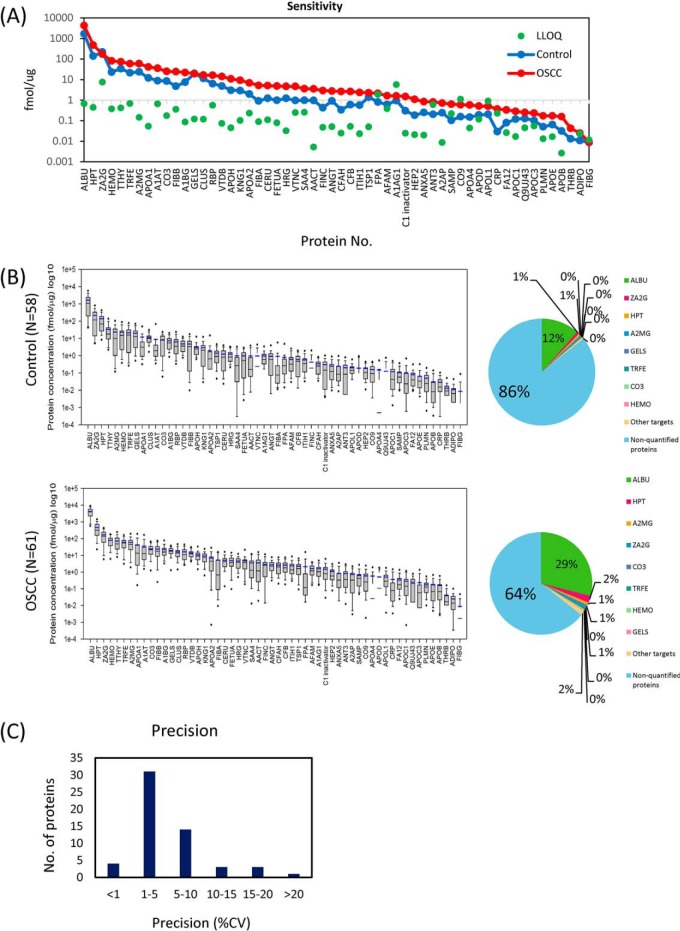
Fig. 3.
A, The distributions of average concentrations of the 56 proteins in control and OSCC saliva samples, and a comparison with LLOQ values. B, The concentration distributions of the 56 target peptides in the control group (n = 58) and oral cancer (n = 61) determined using the MRM/MS approach. The calculated concentration is minimum estimated concentration in saliva by assumption of 100% yield of trypsin digestion. The horizontal black lines in each box plot denote the 10th, 25th, 50th, 75th and 90th percentiles of the data distribution. The horizontal blue line in each box plot denotes the average concentration value for each protein. The two dots denote the 5th and 95th percentiles of the data distribution. C, Reproducibility of protein quantification is showed as CV values.

