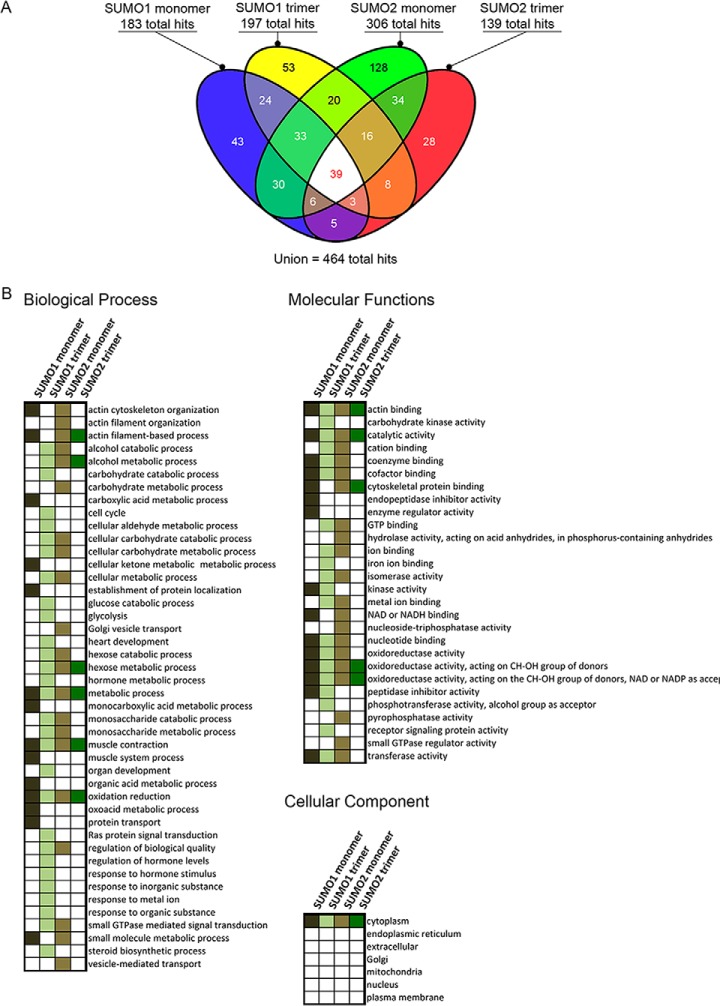
Fig. 2.
Identification of SUMO binding proteins using human proteome microarrays. A, Venn diagram showing the number of SUMO-binding experiment hits for each probe tested. B, Gene ontology analysis on proteins identified in our screen for SUMO-binding proteins. Gene ontology categories that are significantly enriched among proteins that bound to one of our four probes are shown as a colored box, color-coded by probe.

