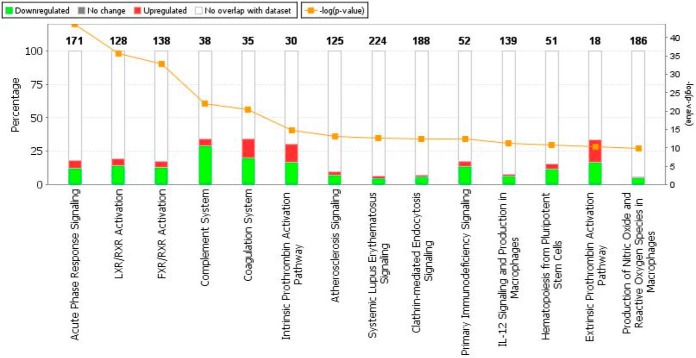
Fig. 3.
Top enriched pathways for the 107 differentially expressed proteins based on the ANOVA analysis, ranked in increasing order of their Fisher exact test p value (Ingenuity pathway analysis, default background comparison). Green - proteins with decreased expression in neonates; Red - proteins with increased expression in neonates; White - no overlap with the data set; Orange - log (p value), Fisher exact test, right tailed.

