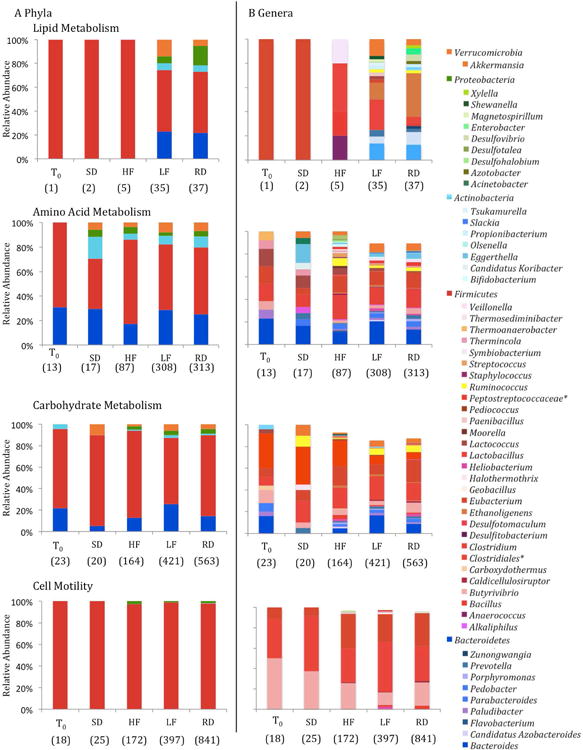
Figure 4.

The relative abundance of KEGG level 2 functional transcripts attributable to dominant taxa at (A) phylum and (B) genus level. Taxa with less than 1% relative abundance were not included. The total number of transcripts for all taxa are listed below each bar. *Represents unclassified families or genera.
